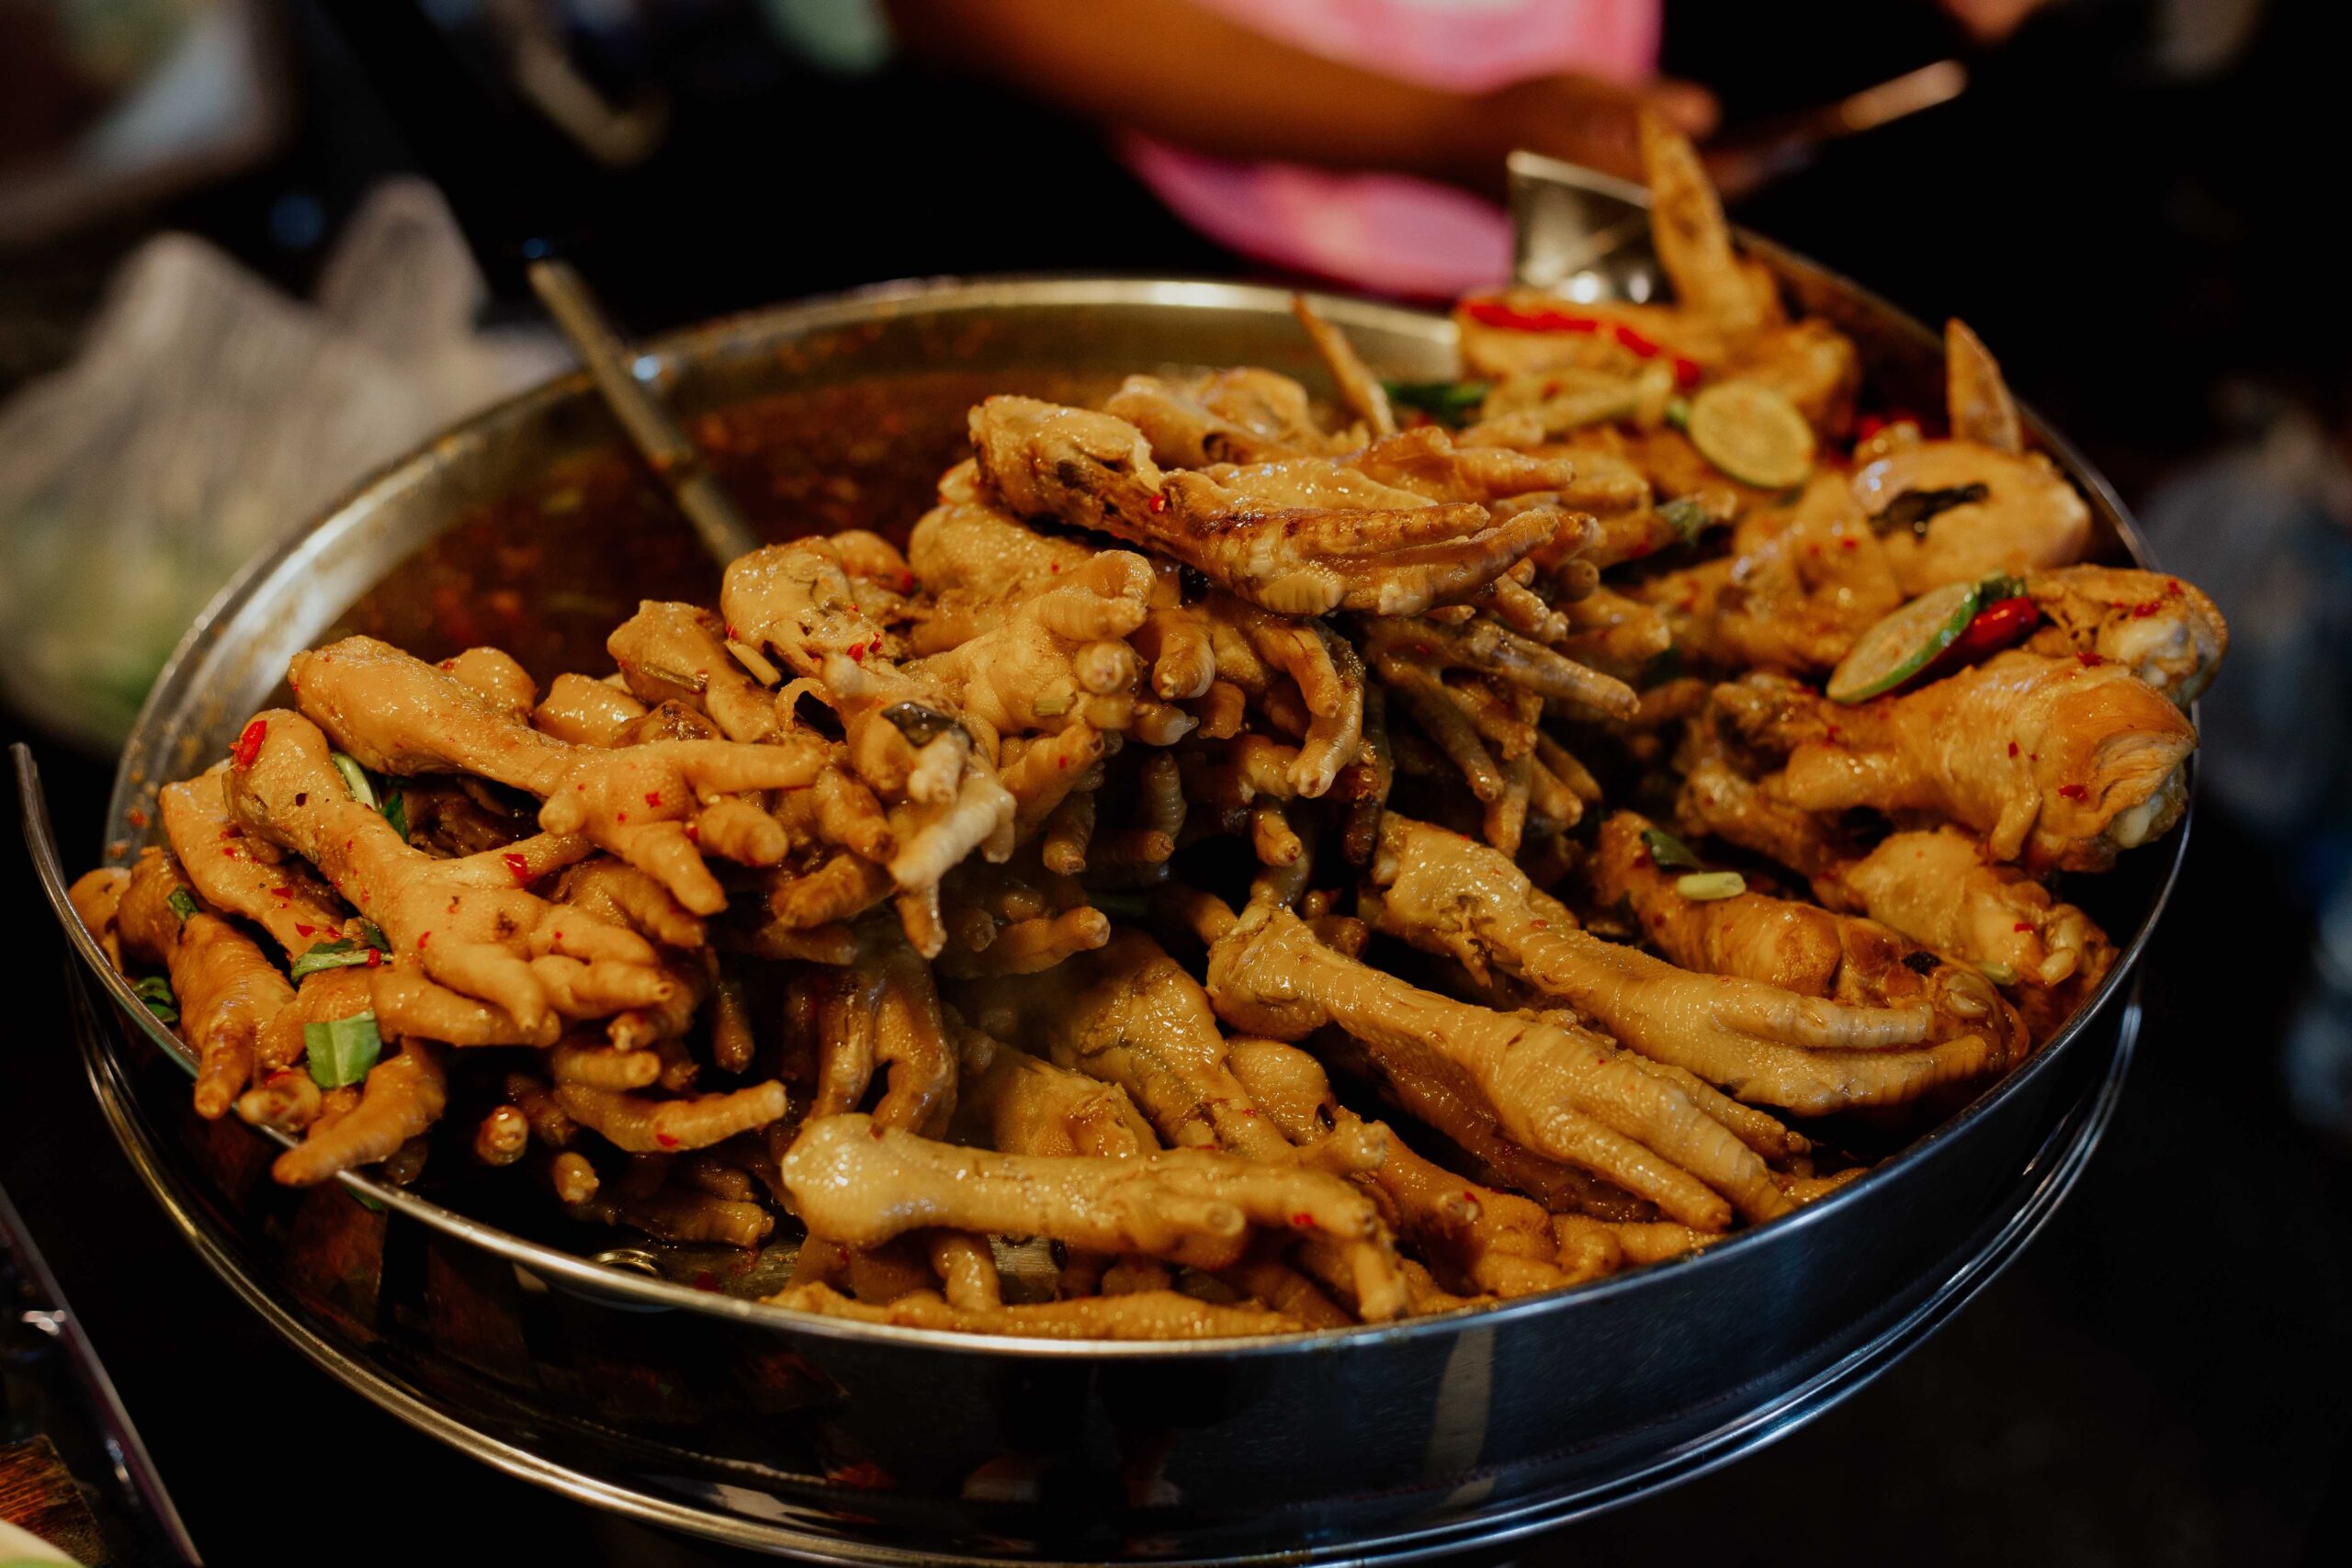
According to the U.S. Department of Agriculture (USDA, 2023), U.S. producers shipped nearly $6.0 billion in poultry meat and related products (excluding eggs) to over 130 countries in 2022. China has emerged as the second largest destination for U.S. poultry exports, increasing from only $10 million in 2019 to a record $1.1 billion in 2022. This is a remarkable increase of more than 10,000% in just 4 years. Recall that China banned all U.S. poultry in January 2015 due to a highly pathogenic avian influenza (HPAI) (i.e., bird flu) outbreak in December 2014. Despite the U.S. being free of the disease by August 2017, the ban was not lifted until November 2019 (USDA, 2019). Since that time, however, the recovery of U.S. poultry in the Chinese market has been phenomenal. What is interesting is that this recovery has been driven by one product, frozen chicken feet (or paws), which are apparently preferred by Chinese consumers for their unique large size and consistent high quality (Baych, 2022). In 2022, frozen chicken feet accounted for more than 85% of all U.S. poultry exported to China.
Figure 1 shows China’s frozen chicken feet imports from all major supplying countries. In 2010, frozen chicken feet imports in China were $571 million, and averaged only $350 million annually from 2010 to 2018. Since that time, however, China’s frozen chicken feet imports increased to $2.6 billion by 2022, primarily driven by imports from the U.S. In 2022, the U.S. accounted for 43% of China’s frozen chicken feet imports, followed by Brazil (20%), Russia (11%), Argentina (5%), and Chile (3%).
Unfortunately, recent bans due to HPAI outbreaks in 2022 are limiting U.S. exports from certain states in 2023. This is occurring at a time when the Chinese are paying significantly more for imported frozen chicken feet. For example, import prices for frozen chicken feet from the U.S. were around $1.00/kg in 2014. In 2023, U.S. prices averaged between $5.00kg and $6.00/kg. Current restrictions are hurting overall U.S. sales to China and appears to be benefiting Brazil and Russia. As of June 2023, U.S. frozen chicken feet sales to China were down by 35% in terms of value and 51% in terms of volume. However, imports from Brazil and Russia were up, particularly in terms of value by 77% and 42%, respectively (See Table 1). The lifting of the HPAI ban in 2019 and the enforcing of bans on certain states in 2023 have given and taken away, respectively.
Figure 1. China’s Frozen Chicken Feet Imports by Country of Origin: 2010-2023

Table 1. China’s Frozen Chicken Feet Imports from Brazil, Russia, and the United States: 2022 and 2023 Year-to-Date (January-June) Comparisons
| Jan-June 2022 | Jan-June 2023 | % Change |
| Brazil | ||
| $198.3 million | $351.8 million | 77.4% |
| 81.9 TMT | 86.6 TMT | 5.7% |
| Russia | ||
| $106.4 million | $150.9 million | 41.8% |
| 37.4 TMT | 39.1 TMT | 4.4% |
| United States | ||
| $550.4 million | $358.3 million | -34.9% |
| 133.7 TMT | 65.2 TMT | -51.2% |
Source: Trade Data Monitor® (China Customs) (2023)
References
Baych, A. 2022. Poultry and Products Annual Country: People’s Republic of China. USDA GAIN Report Number: CH2022-0100. Foreign Agricultural Service, Washington, DC.
U.S. Department of Agriculture (USDA). 2019. American Poultry Farmers Regain Access to China. USDA Press Release No. 0176.19. https://www.usda.gov/media/press-releases/2019/11/14/american-poultry-farmers-regain-access-china
U.S. Department of Agriculture (USDA). 2023. Global Agricultural Trade System (GATS). Foreign Agricultural Service, Washington, DC.

