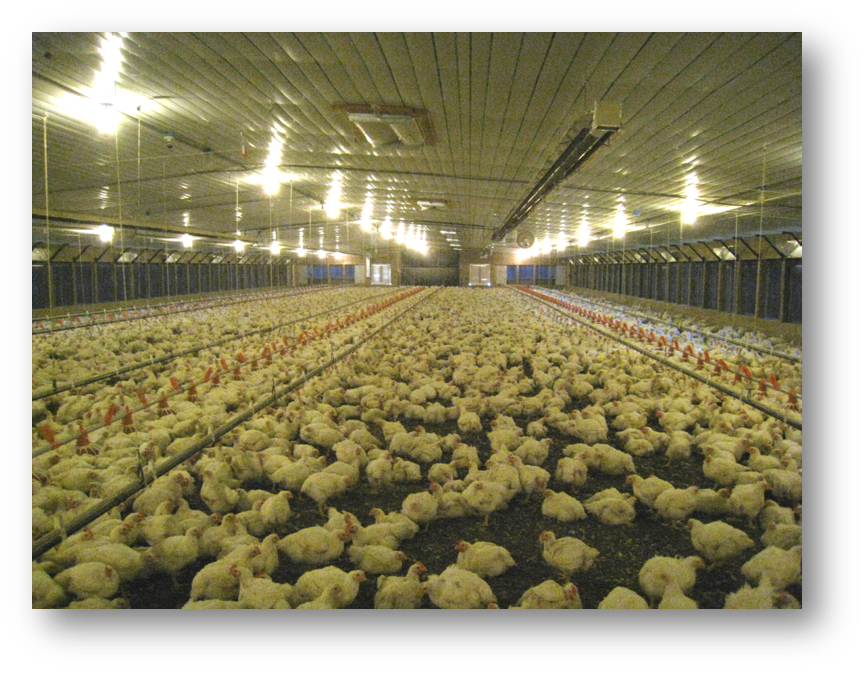
The U.S. is the largest chicken meat producing country in the world. According to the U.S. Department of Agriculture, production in 2022 was almost 21 million metric tons (MT) (ready to cook equivalent), with the next largest country (Brazil) producing around 14.5 million MT. While most of this production is consumed domestically, between 10% and 20% of total production is exported each year (USDA, 2023a). In 2022, U.S. exports of poultry products – including chicken, turkey, and other fowl – accounted for $6 billion in global sales, making poultry products a top ten U.S. agricultural export. The leading poultry export for the U.S. is frozen chicken leg quarters (henceforth leg quarters), which accounted for $1.9 billion in export sales in 2022, nearly a third of all U.S. poultry exports (USDA, 2023b).
Important to U.S. poultry exports is the country of Angola, which is located on the western Atlantic coast in the South African region. In 2022, Angola was the leading foreign destination for U.S. leg quarters in terms of value ($219 million) and the second largest foreign market in terms of volume (168 thousand MT). However, U.S. leg quarter exports to Angol have varied significantly over the last decade (See Figure 1), decreasing from a peak in 2014 ($243 million) to only $83 million in 2016. After 2016, U.S. exports recovered but immediately fell again during the pandemic in 2020. Since 2020, U.S. leg quarter exports to Angola significantly increased to $219 million in 2022. However, as Figure 1 shows, this was mostly due to higher chicken prices.
Unfortunately, the U.S. is facing increasing competition in Angola from rising domestic production as well as competition from Brazil. In 2022, for instance, Angola’s imports of frozen chicken cuts (including leg quarters, other cuts, and offal) from the U.S. were up 23% (volume) in 2022, whereas imports from Brazil were up 32% (UN Comtrade, 2023). Despite U.S. leg quarter exports to all destinations being down by only 8% in terms of volume in 2023 (year-to-date as of August), exports to Angola were down 25% (USDA, 2023b). Figure 2 shows Angola’s frozen chicken cut imports in 2021 ($201 million) by exporting source. The U.S. was the leading supplier, accounting for 63%; Brazil accounted for 22%. 2023 year-to-date data for the U.S., as well as 2022 data for Angola, suggest that Brazil will likely account for more than a third of total imports by the end of 2023, while the U.S. share will likely decrease to slightly more than 50%.
Figure 1. U.S. frozen chicken leg quarter exports to Angola: 2010 – 2022

Figure 2. Angola frozen chicken cuts imports (including leg quarters, other cuts, and offal) in 2021 by Source ($201 million)

References
Observatory of Economic Complexity (OEC). 2023. https://oec.world/en
United Nations Comtrade Database (UN Comtrade). 2023. https://comtradeplus.un.org/
U.S. Department of Agriculture (USDA). 2023a. Livestock and Poultry: World Markets and Trade. Foreign Agricultural Service, Washington, DC.
U.S. Department of Agriculture (USDA). 2023b. Global Agricultural Trade System (GATS). Foreign Agricultural Service, Washington, DC. https://apps.fas.usda.gov/gats/default.aspx
Muhammad, Andrew, and Md Deluair Hossen. “Angola: U.S. Chicken Exports Facing Increasing Competition in this Leading Market.” Southern Ag Today 3(44.4). November 2, 2023. Permalink

