
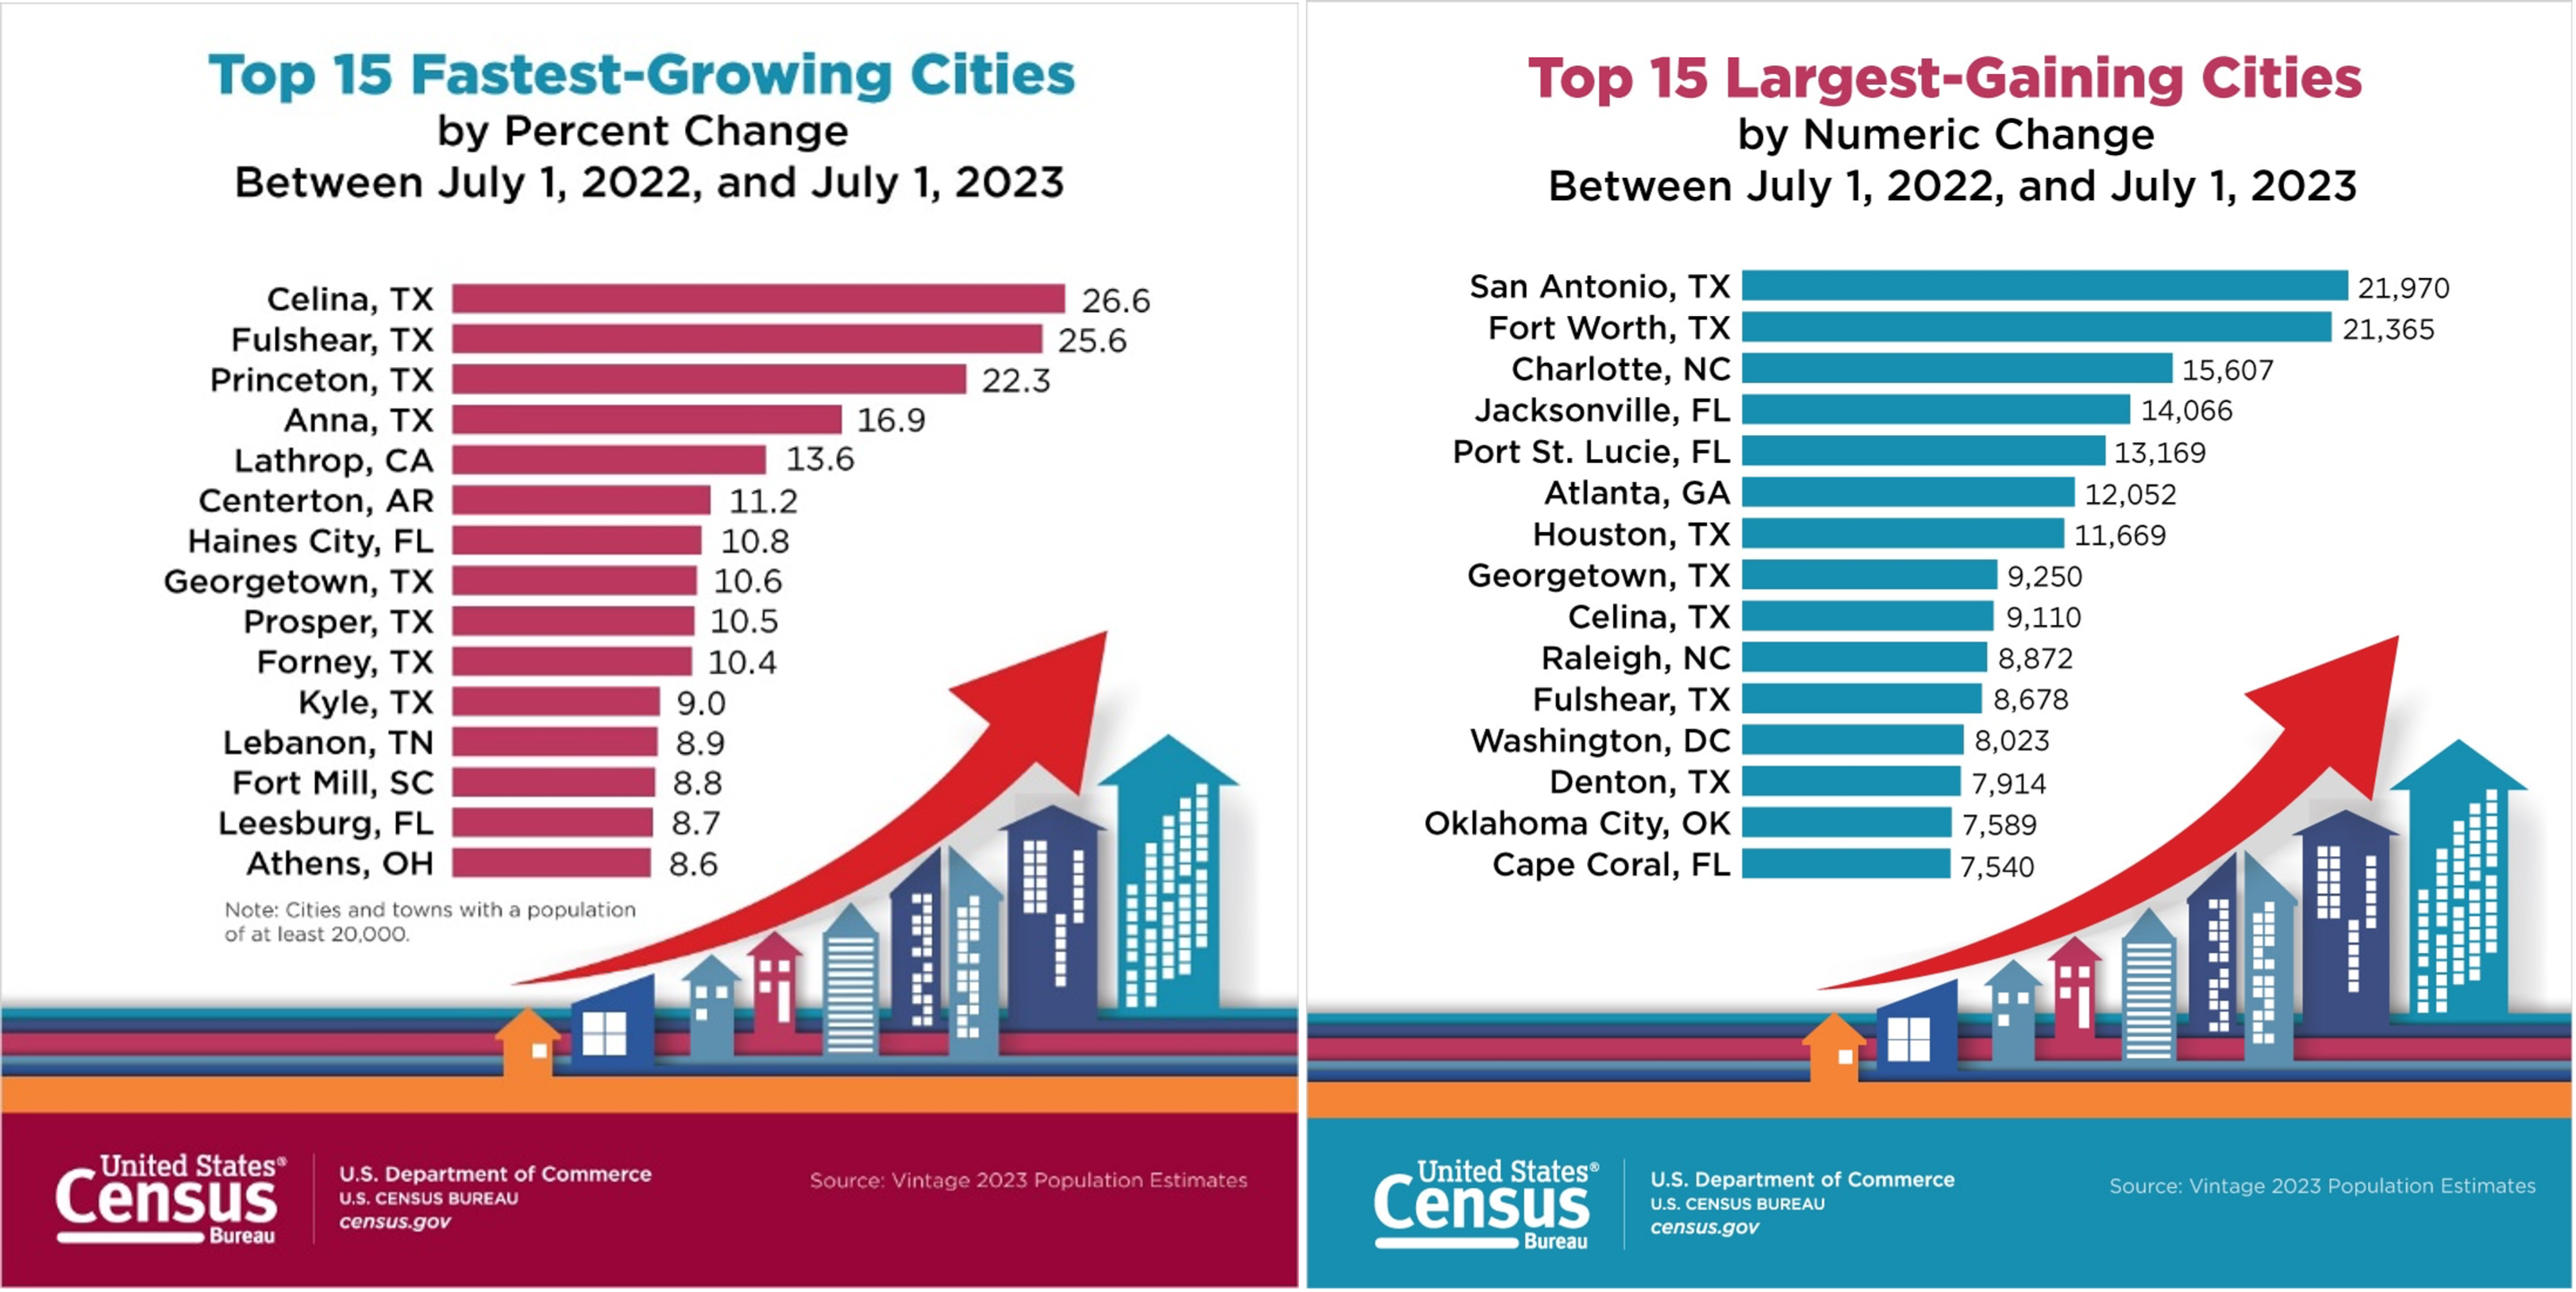
The upward trend in the South’s population growth has been further accelerated by post-COVID-19 migration. According to the U.S. Census, southern cities dominated both the 15 fastest-growing cities and the 15 largest-gaining cities between July 1, 2022, and July 1, 2023 (Figure 1). The distinction between these two groups lies in their composition: the top 15 largest cities on this list are predominantly major urban cities, whereas the fastest-growing cities are mostly small towns that have benefited from larger cities’ migration outflow. Accordingly, this new list of the fastest-growing cities in the U.S. raises an important question: How has the housing price landscape changed in the South since the pandemic?
Figure 1. Top 15 Fastest-Growing Cities and Largest-Gaining Cities between July 1, 2022 and July 1, 2023
To answer this question, the Zillow Home Value Index (ZHVI), a smoothed and seasonally adjusted measure of typical home values in the 35th to 65th percentile range, was used to observe the percentage changes in house prices from March 31, 2020, to March 31, 2024, following the World Health Organization’s declaration of COVID-19 on March 11, 2020.
Figure 2 illustrates the percentage changes in house prices across southern states from March 31, 2020, to May 31, 2024. Overall, significant increases were observed in most states, with notable rises exceeding 50% in five states: Florida (58%), Georgia (56%), North Carolina (55%), Tennessee (52%), and South Carolina (50%) since the onset of the pandemic. Conversely, Louisiana and Washington D.C. saw a modest increase of less than 10% during this period, distinct from the upward trends observed elsewhere. In addition, the county-level map (Figure 3) provides geographical insight into the house price landscape. As we can see, house prices in the counties along the Mississippi Delta and a large portion of western and southern Texas counties increased noticeably less or even decreased compared to other regions. These clustered patterns resemble the recent net domestic migration map (2021-2022) from the U.S. Census (U.S. Census Bureau, 2023, March 30). One notable difference is that negative net domestic migration in big cities has rebounded, whereas the net domestic migration around the Mississippi Delta area continues to face challenges, resulting in decreased house prices.
Figure 2. House Price Percentage Changes by State from March 31, 2020, to May 31, 2024, in the Southern Region
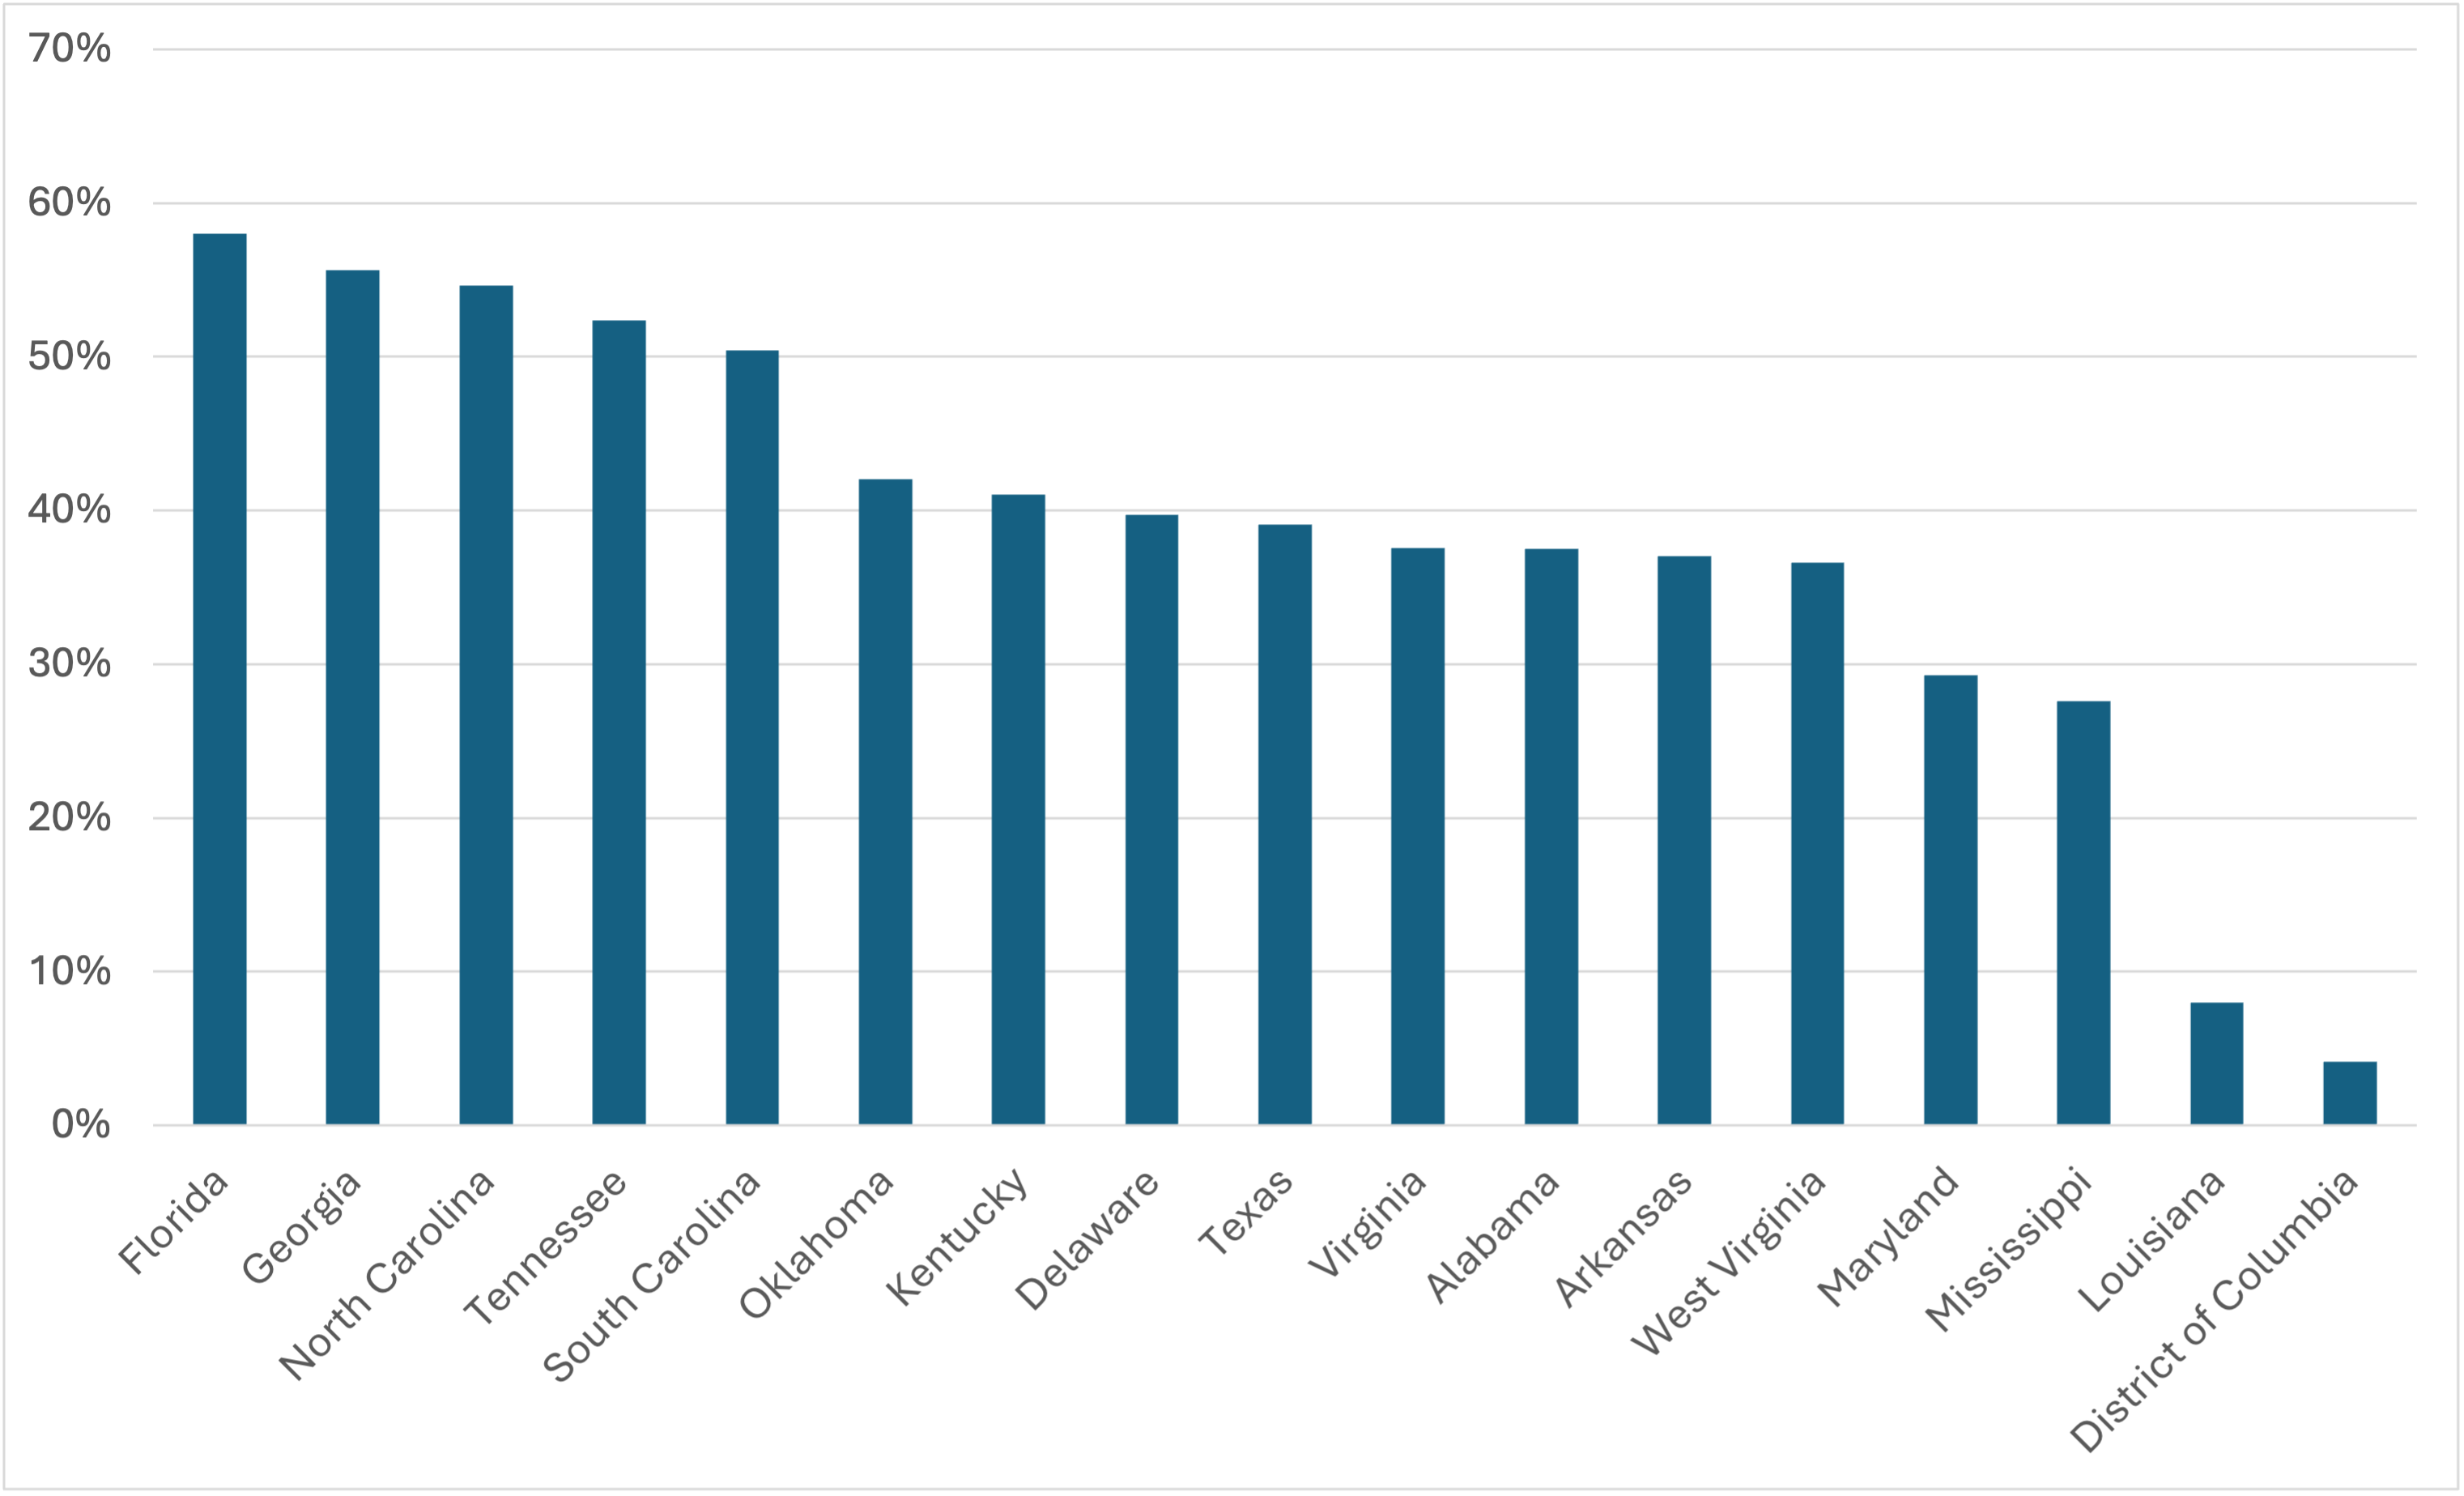
Figure 3. House Price Percentage Changes by County from March 31, 2020, to May 31, 2024, in the Southern Region
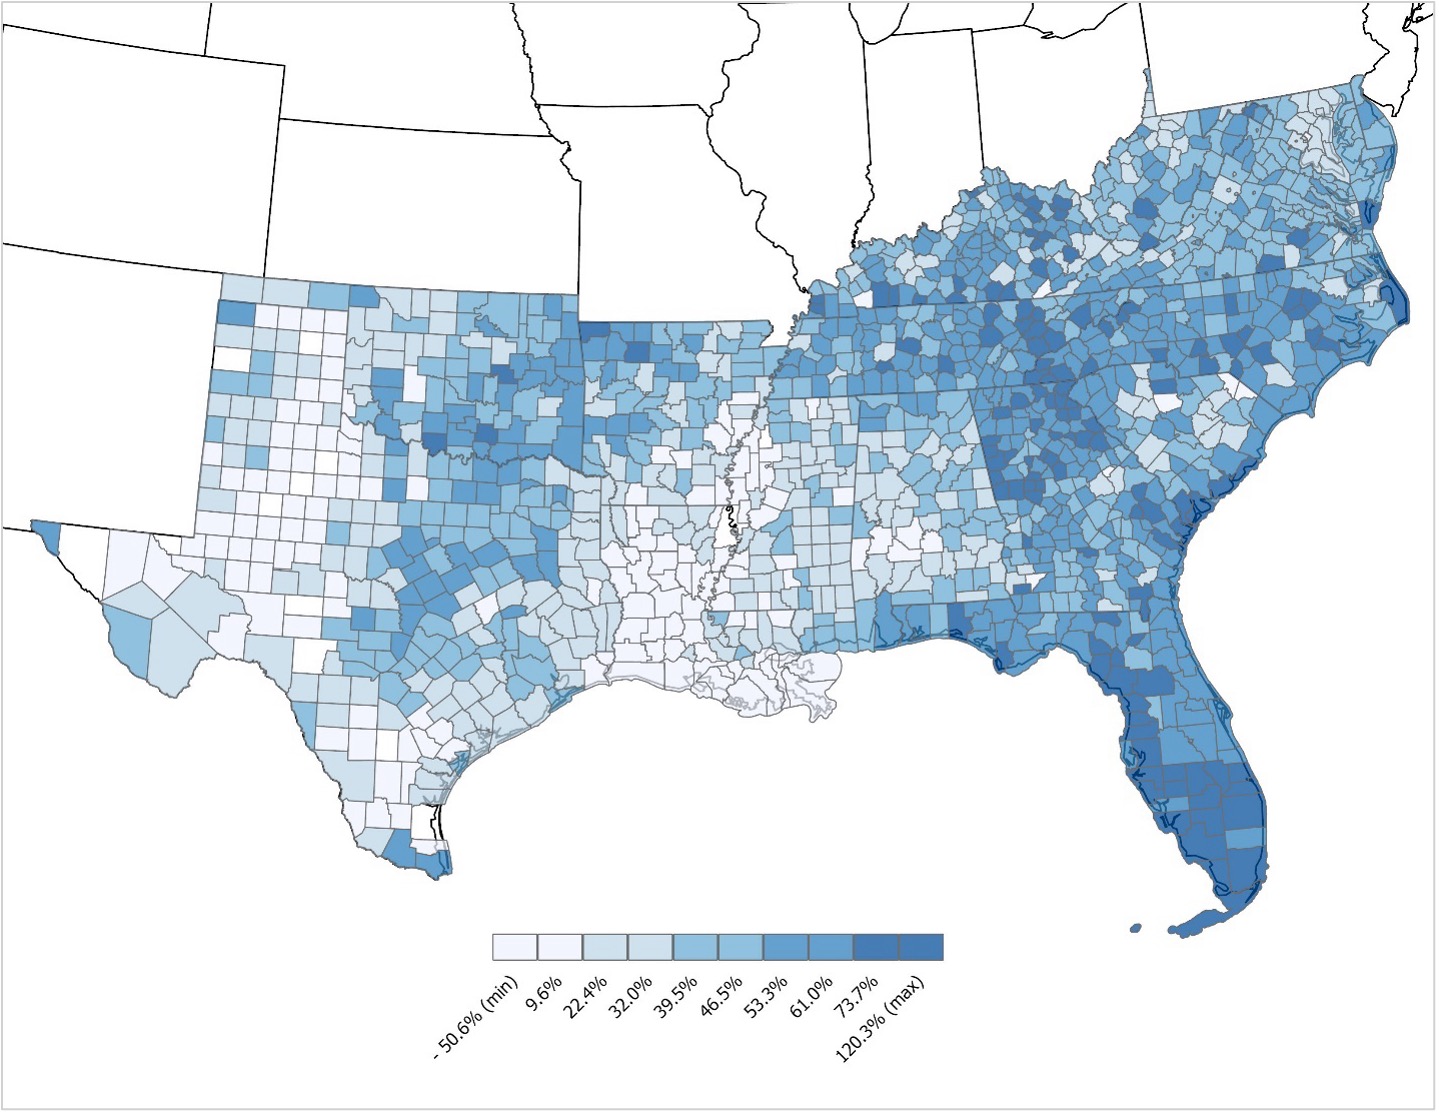
Note 1: There is a less than 1% likelihood that this clustered pattern could be the result of random chance (Moran’s I: 0.5895, z-score: 90.5022, p-value: 0.0000)
Note 2: No data is available for the empty counties
So, what exactly does the house price landscape tell us? The sharp increase in house prices across the southern region of the U.S. since the pandemic underscores the immediate need for supportive measures. As housing costs escalate, there is a critical need to prioritize actions that enhance affordability and ensure equitable access to housing. Considering the rising population trend in the South, it is likely that home prices there will keep climbing, exacerbating the issue of housing affordability. In contrast, underserved regions, such as the Mississippi Delta, which are experiencing negative domestic migration trends worsened by the pandemic, may see community development challenges intensify in the future. Therefore, by addressing these dual issues with strategic and supportive approaches, policymakers can promote a more inclusive and sustainable recovery across the diverse landscapes of the South.
References
U.S. Census Bureau. (2024, May 16). Population rebounds for many cities in Northeast and
Midwest. Census.gov. https://www.census.gov/newsroom/press-releases/2024/subcounty-population-estimates.html
U.S. Census Bureau. (2023, March 30). Domestic Outmigration From Some Urban Counties Slowed,
Smaller Gains in Rural Counties. Census.gov. https://www.census.gov/library/stories/2023/03/domestic-migration-trends-shifted.html