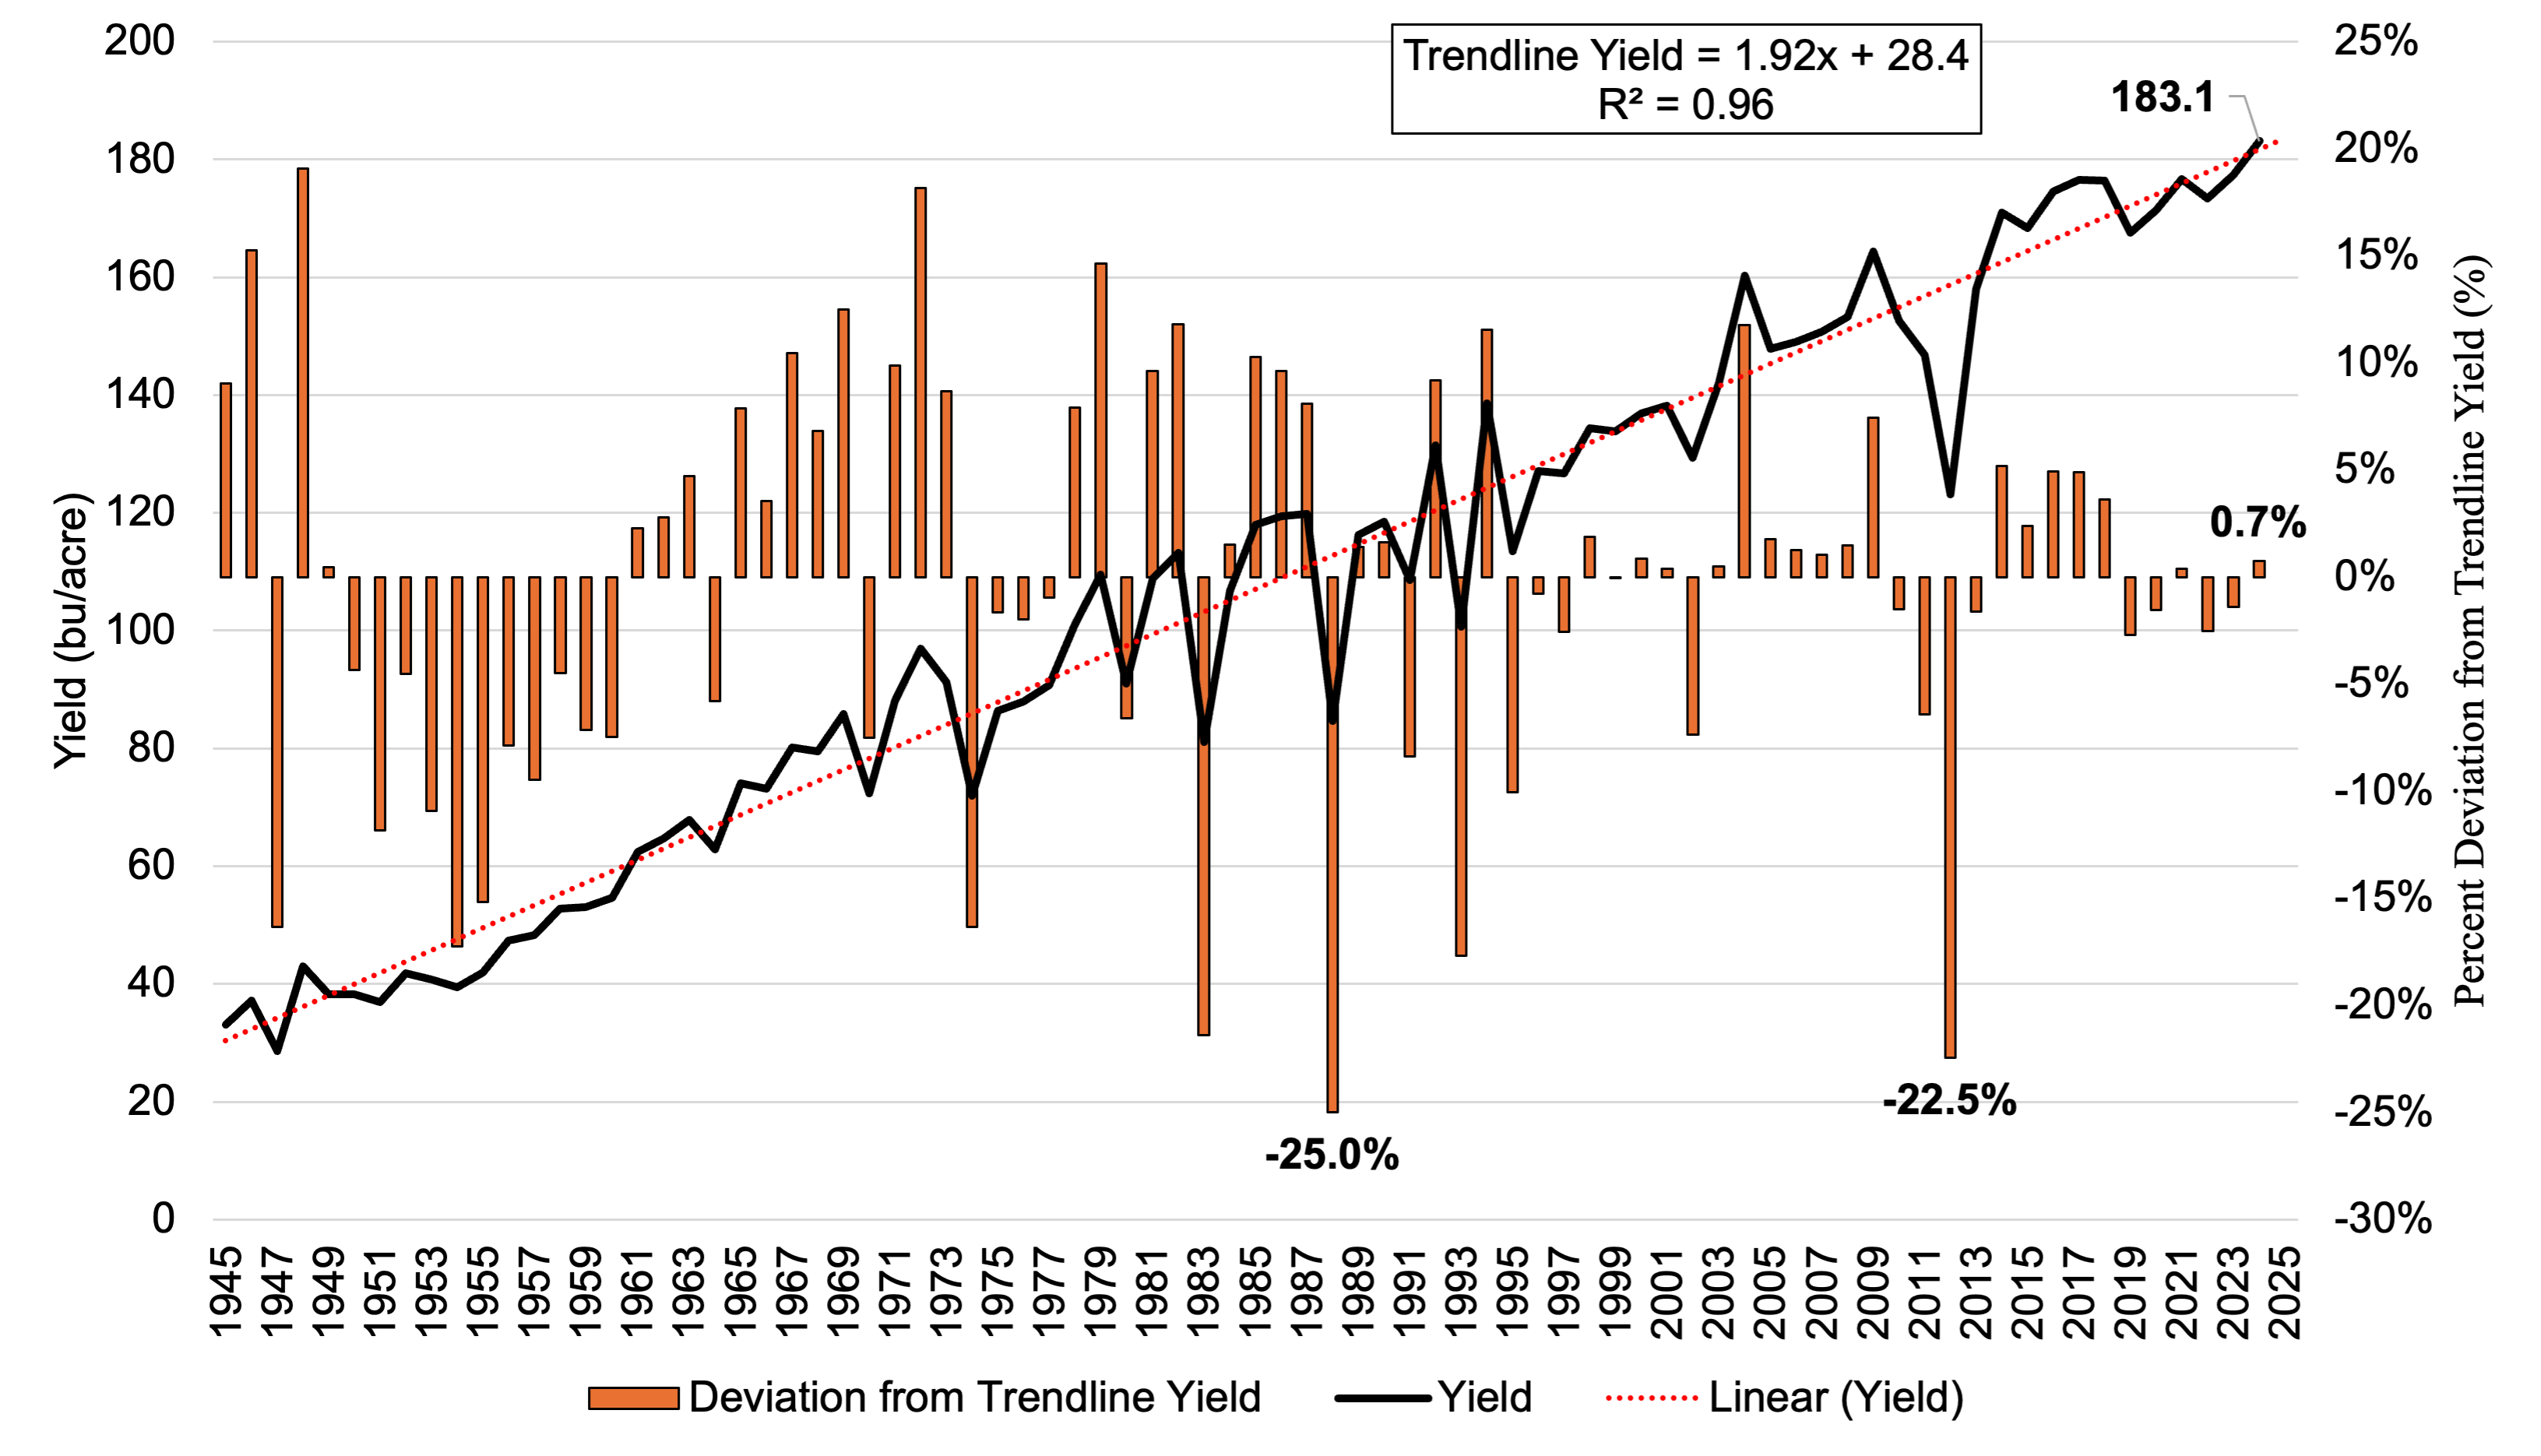
The USDA is currently forecasting a record national average corn yield of 183.1 bushels per acre for 2024 (Figure 1). Record yield and flat demand have contributed to projected ending stocks of over 2 billion bushels, pushing December corn futures contract prices from $4.80/bu in May to a low of $3.85/bu at the end of August. Additionally, record yields across many regions will provide a weaker than typical basis for many corn producers. USDA will continue to modify yield estimates as additional harvest data are collected this fall and winter. The USDA’s final yield estimate will be provided in January 2025. This article examines national corn yields and changes in percent yield deviation from a trendline over time.
Figure 1. U.S. corn average yield, linear trendline yield, and percent deviation from trendline, 1945-2024

Since 1945, U.S. national average corn yield has increased an average of 1.9 bushels per acre per year, or 19 bushels every 10 years. Drought is typically responsible for substantial negative deviations from the trendline (-25% in 1988 and -22.5% in 2012; Figure 1). Severe widespread droughts will continue to negatively impact national average corn yields in the future, presenting as large deviations from a long term trendline. However, there are patterns that emerge in the yield deviation from trendline data. There is a tendency to have multiple years of deviation above trend (2003-2009 and 2014-2018) or below trend (1995-1997 and 2010-2013). The number of years differs, and can contain a contradictory year, but there is a pattern. This is not to say that the current yield indicates that for the next few years yields will be above trendline. The second is there is a smaller percent deviation (positive or negative) from trendline in recent decades. From 1965-1994, U.S. corn yields deviated (+ or -) from trendline by more than 10% in 11 years and by more than 7.5% in 20 out of 30 years (Table 1). By contrast, from 1995-2024, yields deviated by greater than 7.5% in only 3 years. The average percent deviation from trendline from 1995-2024 was 3.7% compared to 9.4% from 1965-1994. Thus, with the exception of a few extreme years, yield in the past 30 years has been following a long term trendline. National average yield impacts the prices producers receive. Understanding long term national, state, and regional yield trends and patterns can assist in formulating a risk management and marketing strategy.
Table 1. The number of years from 1965-1994 and 1995-2024 with national corn yields 10%, 7.5%, 5%, or 2.5% higher or lower than the linear trendline

References
USDA NASS National Corn Yield Data. NASS Quick Stats. https://www.nass.usda.gov/Quick_Stats/
USDA August WASDE Report. https://www.usda.gov/oce/commodity/wasde
Smith, Aaron. “National Corn Yields and Deviation from Trendline Over Time.” Southern Ag Today 4(37.1). September 9, 2024. Permalink

