
One of the most misused and abused numbers in the agricultural policy world is the Net Farm Income (NFI) projection developed by the USDA Economic Research Service. As described in the news release from USDA announcing the latest (September 5th) farm income projections, “Net farm income, a broad measure of profits, is forecast at $140.0 billion in calendar year 2024, a decrease of $6.5 billion (4.4 percent) relative to 2023 in nominal (not adjusted for inflation) dollars.” Figure 1 contains the past 21 years of inflation adjusted net farm income data from the most recent release.
There is nothing wrong with the net farm income number… it just doesn’t mean what people think it means. Why? It is widely used in Washington D.C. as a measure of how well farmers and ranchers are doing which indicates whether or not the safety net needs strengthening in cases where NFI is declining – like now. How does it relate to how well a farmer anywhere in the U.S. is actually doing? It really doesn’t since it is an estimate of the farm income of all types of agricultural operations in the United States. To be meaningful to a farmer, the farmer would have to raise all the commodities included, which would be very unlikely.
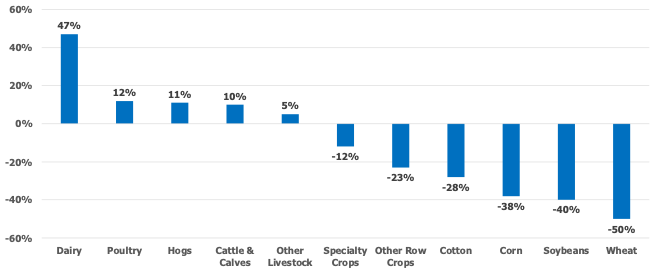
Figure 2 presents the change in inflation adjusted net cash farm income (NCFI) for the commodity categories provided by USDA.[1] Notice while inflation-adjusted NFI in Figure 1 only fell by $10 billion dollars ($150 billion to $140 billion), or 6.7%, from 2023 to 2024, there were significant NCFI declines for crop operations while livestock operations saw increases.
This means that the significant losses in crop agriculture are being masked by the recent boom in profitability of livestock operations. Don’t tell wheat farmers they should feel good that U.S. NFI at $140 billion is above the 21-year average (red line in Figure 1) in 2024 when wheat operations are forecast to have a 50-percent decline in their NCFI. That would be a complete misuse of the data.
Figure 1. U.S. Inflation Adjusted Net Farm Income, 2023 to 2024.
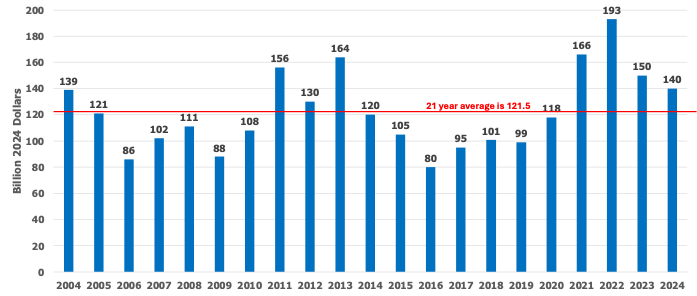
Figure 2. Percent Change in Inflation Adjusted Net Cash Farm Income by Commodity, 2023 to 2024.
[1] NCFI is calculated as gross cash income minus cash expenses. NFI is a broader measure of farm sector profitability that incorporates noncash items including changes in inventories, economic depreciation, and gross imputed rental income.
Outlaw, Joe, Bart L. Fischer, and Natalie Graff. “USDA Farm Income Projections… Misused and Abused.” Southern Ag Today 4(41.4). October 10, 2024. Permalink
