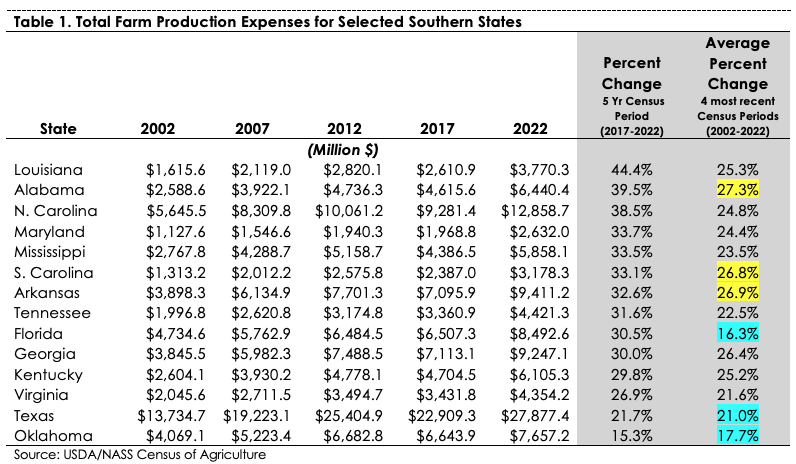
The most recent agriculture Census defines total farm production expenses as “expenses provided by producers, partners, landlords (excluding property taxes), and production contractors for the farm business” (USDA/NASS, 2024). Based on Census data from 2017 to 2022, all southern states experienced higher overall production expenses (Table 1 in descending order based on change from 2017 to 2022). For 2017 to 2022, the top three states with the highest increases in production expenses were Louisiana (44.4% increase), Alabama (39.5%), and North Carolina (38.5%). The lowest were Oklahoma (15.35 increase), Texas (21.7%), and Virginia (21.6%). For the twenty-year timeframe 2002 to 2022, Alabama, Arkansas, and South Carolina had the largest production expense increases (yellow highlight), whereas Florida, Oklahoma, and Texas had the lowest (blue highlight).

Total farm production expenses in the Census are comprised of the following categories 1) fertilizer, lime, and soil conditioners, 2) chemicals, 3) seed, plants, vines, & trees, 4) livestock & poultry, 5) feed, 6) gasoline, fuels, and oils, 7)utilities, 8) repairs, supplies, & maintenance costs, 9) hired farm labor, 10) contract labor, 11) custom work & custom hauling, 12) cash rent for land, buildings, & grazing fees, 13) rent & lease expenses for machinery, equipment, and farm share of vehicles, 14) interest expense, 15) property taxes, 16) medical supplies, veterinary, & custom services for livestock, and 17) all other production expenses (defined as storage and warehousing, marketing and ginning expenses, insurance, etc.).
For these categories, the top five production expense categories summed across all 14 southern states were feeds purchased (28.9% of the total $112.3 billion); livestock and poultry purchased or leased (15.2%); hired farm labor (8.5%), fertilizer, lime, and soil conditioners purchased (6.6%); and repairs, supplies, and maintenance costs (5.8%). The five lowest were property taxes paid (2.2%); custom work and custom hauling (2.1%); contract labor (1.9%); medical supplies, veterinary, and custom services for livestock (1.2%); and rent and lease expenses for machinery, equipment, and farm share of vehicles (0.6%).
Agriculture producers face many challenges. Combined with low commodity prices, the rising cost of production expenses highlighted here illustrate the financial squeeze to a farmer’s bottom line. The resulting lean profits, diminished cashflows, and increased credit reliance threaten the financial viability of many Southern producers. That is why understanding your cost of production is imperative. Going into next year, identify your own high expense categories and manage appropriately.
Menard, R. Jamey. “Census of Agriculture Production Expenses for Southern States.” Southern Ag Today 4(46.1). November 11, 2024. Permalink

