Statistically generated near-term price forecasts are useful to compare/contrast with Extension ad hoc price estimates, USDA monthly price estimates, and trade price estimates. Ongoing cotton price forecasting research at Texas A&M University provides some timely short-term (monthly average) price forecasts that shed light on the 2024 season.
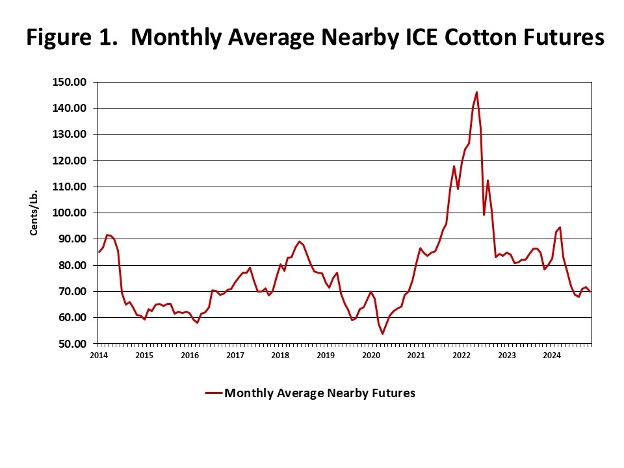
As depicted in Figure 1, over the period January 2014 to August 2024, ICE No.2 cotton monthly average futures prices ranged from 53.75 cents per pound to 146.17 cents per pound, averaging 78.23 cents per pound. The first nine years of this data were used as the training sample for model construction, while the 2024 monthly average prices were used for out-of-sample forecasting using a structural econometric model described in the next paragraph.
Structural econometric models consider the direct effects of specific variables on our dependent variable of interest: ICE No. 2 cotton futures prices. Our best working model specifies monthly average nearby ICE cotton futures as being explained by the monthly stocks-to-use ratio, real disposable personal income, real retail clothing sales, real personal consumption expenditures, the Michigan consumer sentiment index, seasonality indicator variables, and various qualitative factors. We hypothesize that ICE NO.2 cotton futures prices are positively related to real retail clothing sales, real disposable personal income, real personal consumption expenditures, and the Michigan sentiment index but negatively related to the stocks-to-use ratio. After estimating the model coefficients, the signs and magnitudes of the continuous variables in the model conform to prior expectations. This model accounts for roughly 96 percent of the variables in monthly average nearby ICE No.2 cotton futures prices. The results indicate the absence of autocorrelation in the residuals.
Using our econometric model to forecast prices, on average over the out-of-sample period January 2024 to August 2024, the price forecasts deviated from the actual values by 7.75 cents per month (also known as the Mean Absolute Error), or roughly 9.7 percent (also known as Mean Absolute Percent Error). In other words, the out-of-sample ex post forecasts are, on average, higher than the actual monthly average nearby ICE cotton futures price. This result continues with the most recent model forecasts:
- September 2024 Forecast: 76.87 cents per pound (Actual: 70.68 cents per pound)
- October 2024 Forecast: 78.66 cents per pound (Actual: 71.65 cents per pound)
- November 2024 Forecast: 77.60 cents per pound (Actual: 70.03 cents per pound).
So, what does this mean? The results of an otherwise well-fitting statistical model suggest what cotton growers already knew: 2024 was an abnormal year. The nearly thirty-cent decline in monthly average nearby prices between March and August was a statistical anomaly that our model cannot predict.
These kinds of things suggest there are atypical factors affecting price forecasts, which means adjustments need to be made by considering market forces that are not captured by economic modeling.

Robinson, John. “A Statistically Lousy Year for Cotton Prices.” Southern Ag Today 4(50.3). December 11, 2024. Permalink

