The January USDA World Agricultural Supply and Demand Estimates (WASDE) report provided more revisions to the U.S. corn balance sheet. Revisions to USDA domestic corn estimates have been mostly positive for corn prices since the USDA’s September WASDE projections. This month’s revisions propelled March corn futures 20 ½ cents higher in two trading days, from $4.56 to $4.76 ½. Since the September WASDE, March corn futures have increased from $4.04 ¾ to $4.76 ½, a $0.71 ¾ increase.
Was the price increase justified based on the revised information? Yes.
Table 1 compares the USDA WASDE estimates in September to January for corn. The two primary changes were a decrease in the national average yield of 4.3 bu/acre (183.6 to 179.3 bu/acre), a 2.3% decrease, and an increase in exports of 150 million bushels (2.3 to 2.45 billion), a 6.5% increase. Driven by these two adjustments, projected 2024/25 marketing year ending stocks in the United States decreased 517 million bushels, from 2.057 billion to 1.54 billion bushels. A 25.1% decline in ending stocks, combined with the change in use, resulted in a decline in stocks-to-use from 13.7% to 10.2%. Small percentage adjustments to supply and demand can result in relatively large changes in stocks-to-use and the marketing year average price.
Table 1. September and January USDA WASDE Projections for Corn for the 2024/2025 Marketing Year
| 2024/25 Marketing Year Projections | ||||
| September | January | Change | % Change | |
| Planted (million) | 90.7 | 90.6 | -0.1 | -0.1% |
| Harvested (million) | 82.7 | 82.9 | 0.2 | 0.2% |
| U.S. Avg. Yield (bu/acre) | 183.6 | 179.3 | -4.3 | -2.3% |
| Beg. Stocks | 1,812 | 1,763 | -49 | -2.7% |
| Production | 15,186 | 14,867 | -319 | -2.1% |
| Imports | 25 | 25 | 0 | 0.0% |
| Total Supply | 17,022 | 16,655 | -367 | -2.2% |
| Feed and Residual | 5,825 | 5,775 | -50 | -0.9% |
| Ethanol | 5,450 | 5,500 | 50 | 0.9% |
| Food, Seed & Industrial | 1,390 | 1,390 | 0 | 0.0% |
| Exports | 2,300 | 2,450 | 150 | 6.5% |
| Total Use | 14,965 | 15,115 | 150 | 1.0% |
| U.S. Ending Stocks | 2,057 | 1,540 | -517 | -25.1% |
| Foreign Stocks | 10,082 | 10,008 | -74 | -0.7% |
| U.S. Mrk. Year Avg. Price ($/bu) | $4.10 | $4.25 | $0.15 | 3.7% |
| U.S. Stocks/Use | 13.7% | 10.2% | -3.6% | -25.9% |
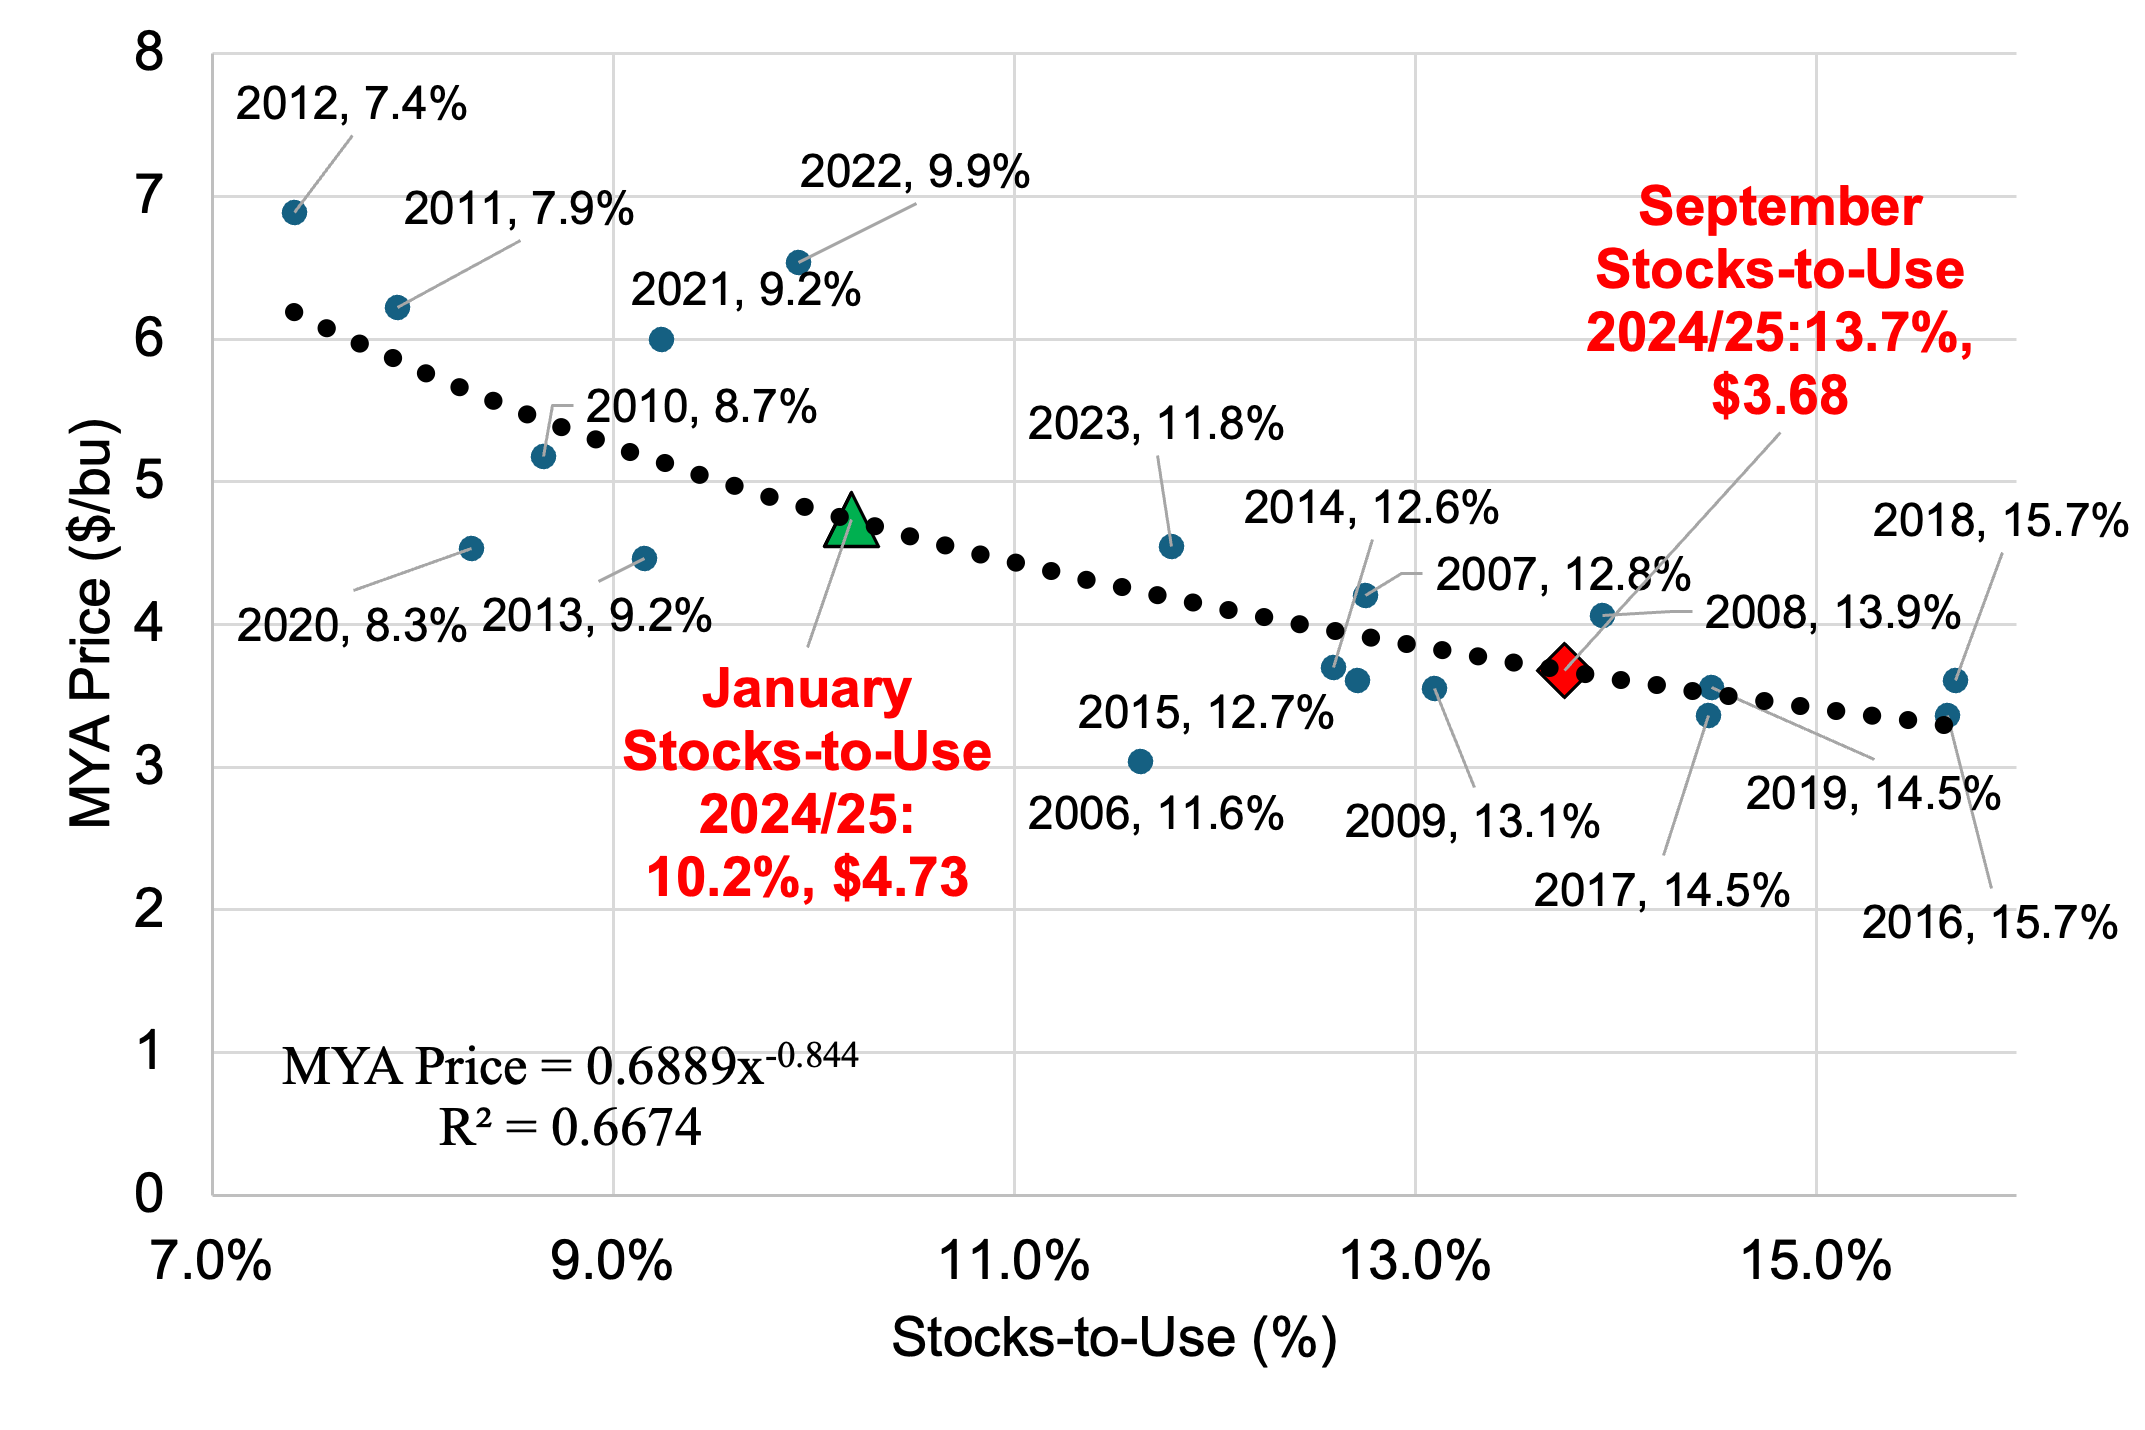
Stocks-to-use is one of the better predictors of the corn marketing year average price. In September, the USDA projected stocks-to-use at 13.7% and estimated the marketing year average price at $4.10, higher than the predicted value of $3.68 (Figure 1). In January, stocks-to-use were projected at 10.2% and the marketing year average price at $4.25, lower than the predicted value of $4.73. The muted response in the USDA WASDE price and the stocks-to-use predicted price can be partially attributed to the crop marketed between September and January.
The key takeaway from the USDA revisions to projected corn supply and demand estimates and the futures market reaction:, the revisions justify the increase in prices. Based on current information, a reasonable nearby corn futures price trading range is $4.60-$5.10.
Figure 1. Corn U.S. Stocks-to-Use Ratio and Marketing Year Average Price 2006/07 to 2023/24

References
USDA World Agricultural Supply and Demand Estimates (WASDE) report. January and September. https://www.usda.gov/about-usda/general-information/staff-offices/office-chief-economist/commodity-markets/wasde-report.
Barchart.com. March 2025 Corn Futures Contract. Accessed at: https://www.barchart.com/futures/quotes/ZCH25/interactive-chart.

