
Sorghum prices have traditionally tracked corn prices, adjusted by a premium or discount primarily dictated by export demand. However, recent trends reveal a decline in sorghum premiums, driven by reduced exports, particularly to China.
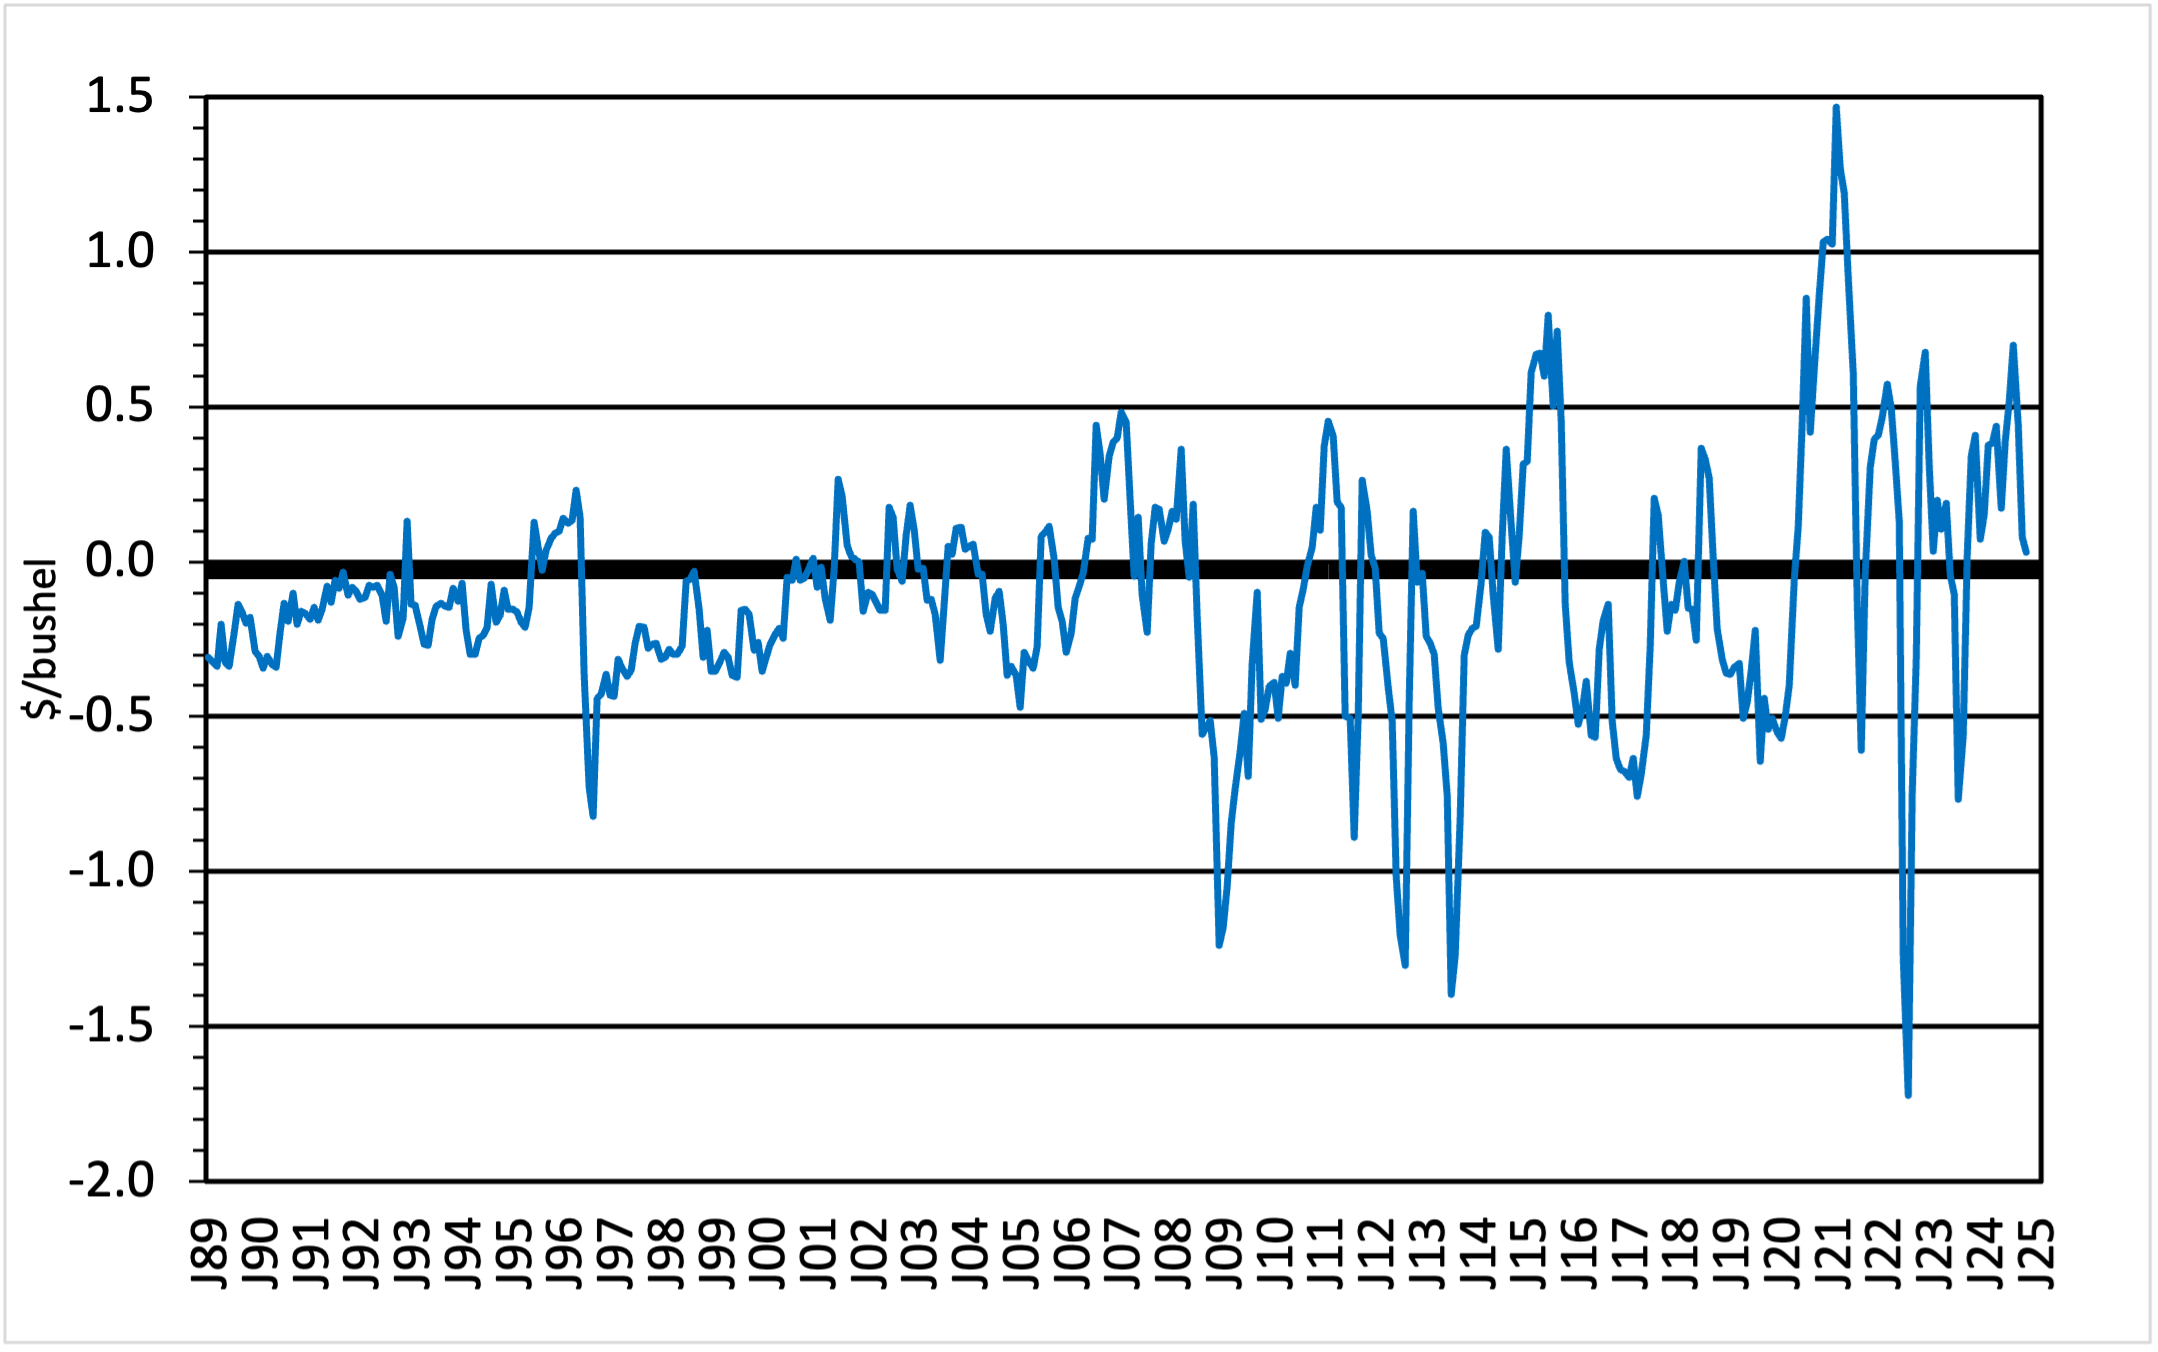
In late 2024, sorghum premiums experienced a significant drop. Figure 1 shows U.S. Average Prices Received by Farmers for Sorghum Minus Corn (January 1989 – November 2024). In August, the premium stood at 70 cents over corn but fell to just 3 cents by November 2024. Projections suggest that December could witness a negative basis. This trend has been particularly pronounced in Texas, where January 2025 prices showed a discount of 59 cents per bushel compared to corn (Texas cash average price for the North, Central, and South Panhandle, USDA, AMS, Market News).
Figure 1. U.S. Average Prices Received by Farmers Sorghum Minus Corn January 1989-November 2024(Source: NASS/USDA/Ag Prices 12-31-24)
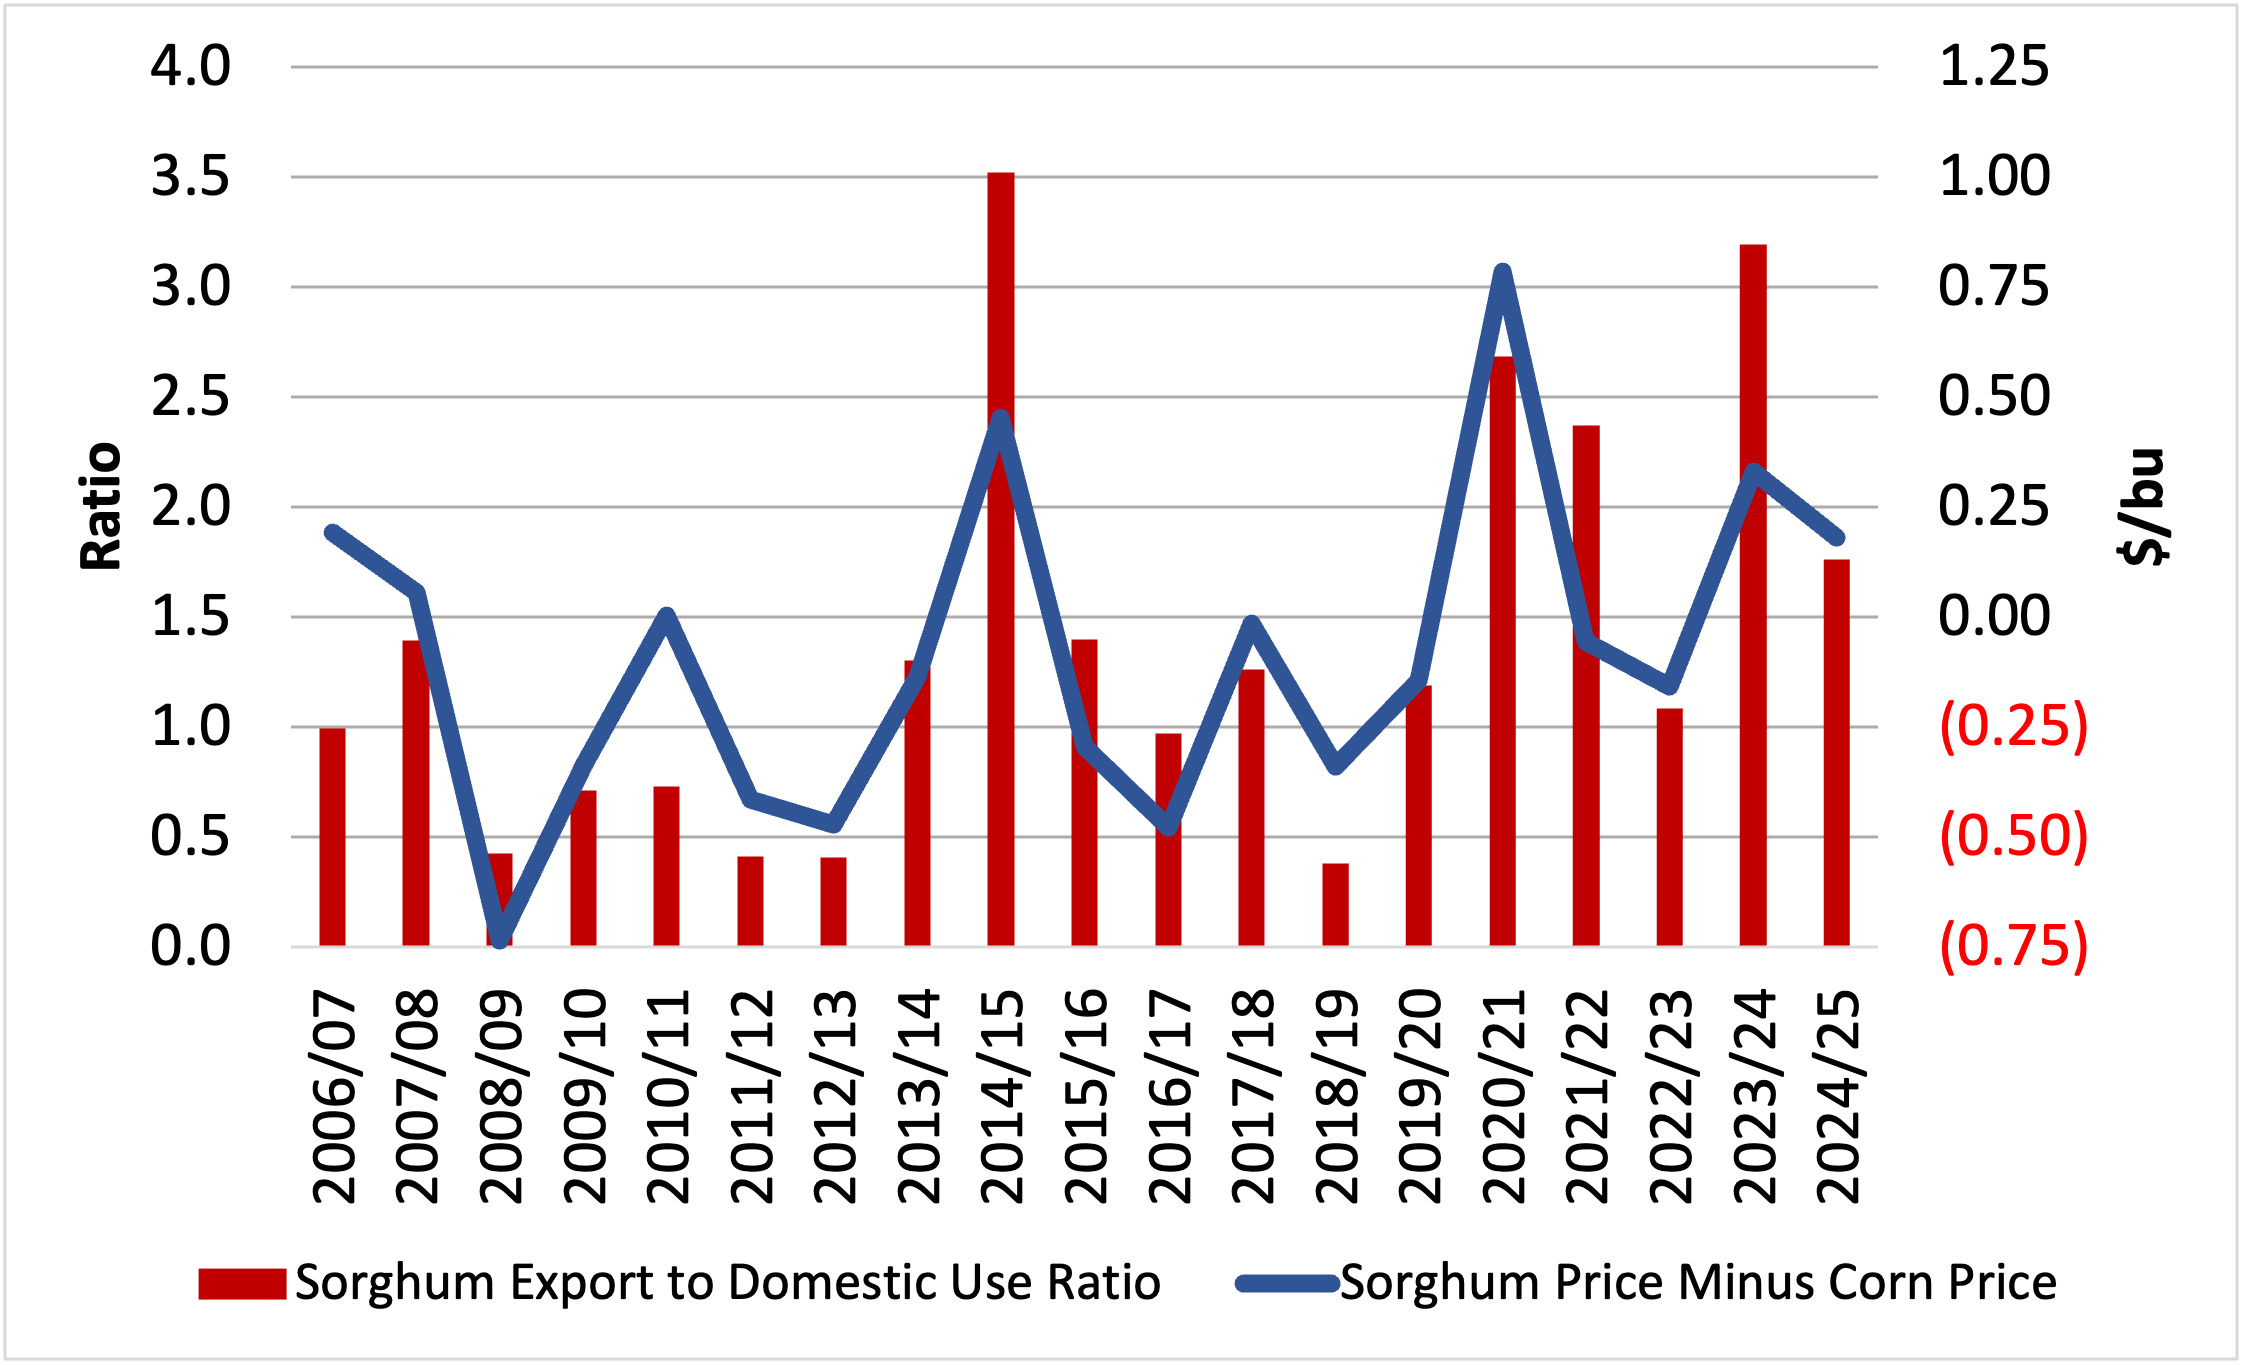
During the 2023/24 season, the level of exports increased along with higher production and lower domestic consumption. Production in 2023/24 increased to 318 million bushels from the previous year of 188 million bushels, a result of significantly larger harvested acreage and better yields. The exports-over-domestic-consumption ratio also increased to 3.00 alongside better premiums over corn (Figure 2).
Figure 2. Sorghum to Corn (Premium or Discount) and the ratio of sorghum exports to domestic use. Source (Dr. M. Welch, USDA February WASDE, USDA, NASS Agricultural Prices)
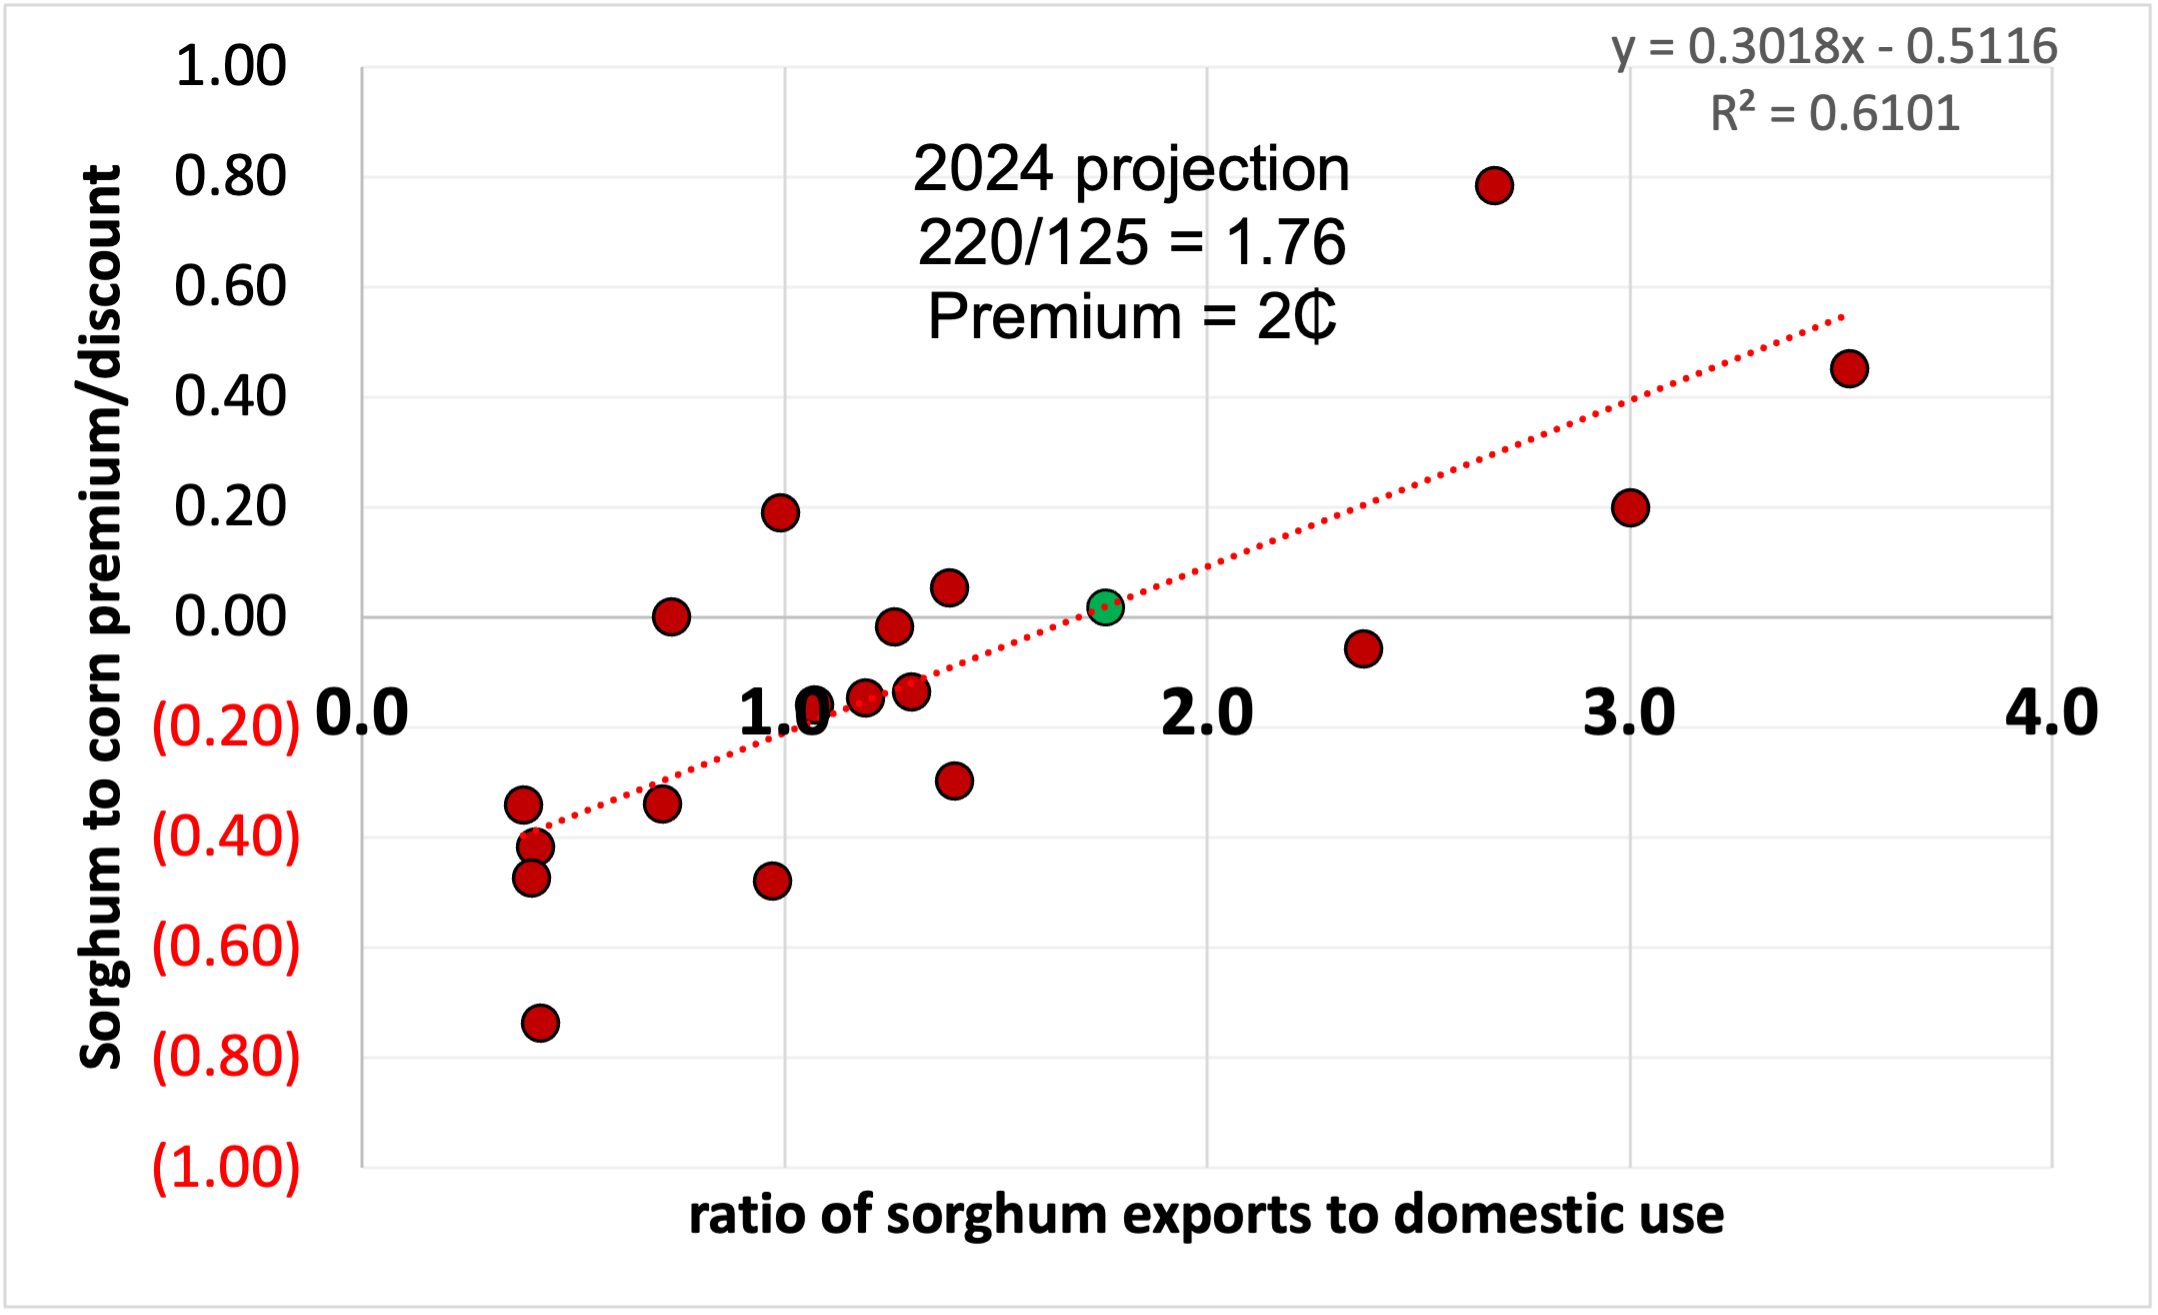
Looking ahead, USDA’s January WASDE projections anticipate a 23-million-bushel increase in 2024/25 production, along with a rise in domestic use to 125 million bushels. WASDE increased area harvested and projected yield for the 2024/25 season compared to their latest report in December 2024. However, exports are projected to remain steady at 220 million bushels. This results in a reduced export-to-domestic-use ratio of 1.76, implying a likely premium of just 2 cents per bushel using Dr. Welch’s model to calculate sorghum-to-corn premium or discount as a function of the ratio of sorghum exports to domestic use (Figure 3). However, we are five months into the marketing year and this ratio may change as the marketing year progresses and USDA revises sorghum domestic use and export estimates.
Figure 3. Sorghum-to-Corn Premium/Discount as Function of the Ratio of Sorghum Exports to Domestic Use. Source: Dr. Mark Welch, USDA February 2024 WASDE and 2024 Ag Outlook Conference.
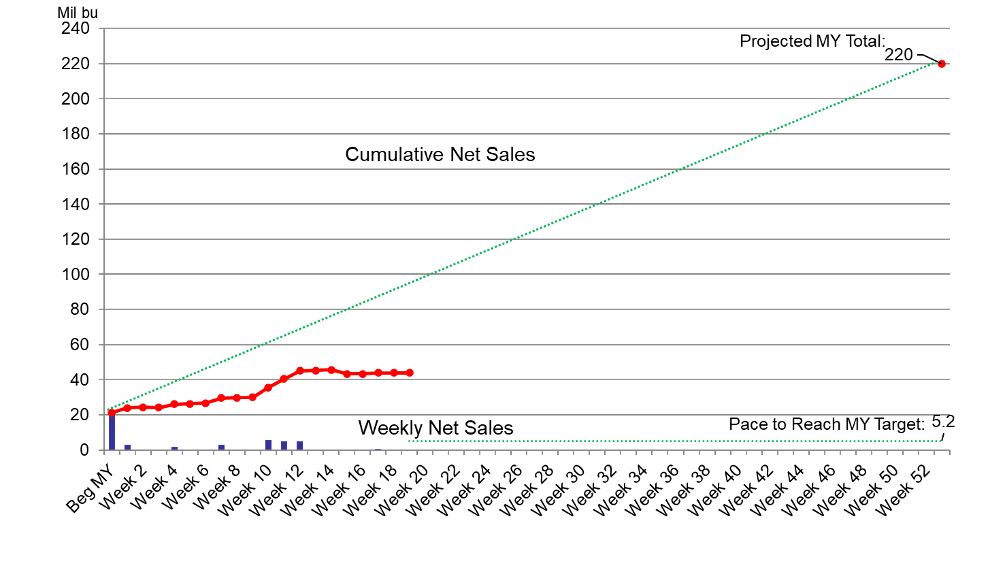
The slowdown in Chinese sorghum imports has exacerbated discounts. As of January 2025, U.S. sorghum export sales commitments represent only 20% of the USDA’s projected marketing year exports, far below the historical average of 75% by March (Figure 4). This shortfall has driven premiums downward and widened discounts across various regions. With only 20% of projected exports committed by January 2025, achieving the USDA’s 220-million-bushel forecast appears challenging. The direction of trade policies and tariffs will influence U.S. sorghum exports. Whether this is positive or negative for sorghum prices is yet to be determined.
Figure 4. U.S. Grain Sorghum Export Sales Commitments, 2024/25 MY. (Source: USDA, FAS, January 16, 2025).
Abello, Pancho. “Export Challenges Drive Down Sorghum Premiums.” Southern Ag Today 5(4.3). January 22, 2025. Permalink
