In May, the USDA Economic Research Service (ERS) released commodity cost and return estimates for crop and livestock products grown in the United States. These estimates are published twice a year and offer insights into the costs faced by the “average” producer at the national and regional levels across the United States. Additionally, on June 18, ERS released cost-of-production forecasts for the 2025 and 2026 production years. This article uses the ERS data to examine changes in operating costs[1] for producers in southern states since 2022, when farm operating costs peaked, and to estimate future cost trends.
Figure 1 compares operating costs for selected crops in 2022, 2023, and 2024 based on ERS data. Note that ERS divides states into farm resource regions for their estimates. The Prairie Gateway includes most of Texas, parts of New Mexico, Oklahoma, Colorado, and Nebraska, as well as all of Kansas. The Southern Seaboard consists of the easternmost counties of Texas, the northwestern counties of Louisiana, the southeastern counties of Mississippi, and most of Alabama, Georgia, South Carolina, North Carolina, and Virginia. Finally, the Mississippi portal covers the eastern parts of Arkansas and Louisiana, along with the western parts of Tennessee and Mississippi.
The data show that operating costs in the southern United States have decreased from their recent highs in 2022; however, they are still significantly above their 10-year averages. The only exception is cotton in the Prairie Gateway states, where increases in ginning costs (due to higher production in 2023 and 2024) and interest costs were enough to offset reductions in other expenses. Table 1 outlines the changes in specific operating costs from 2022 to 2024, explaining why overall costs have decreased since 2022. Unsurprisingly, reductions in operating expenses are mainly due to lower costs for fertilizer, chemicals, and fuel over the past two years.
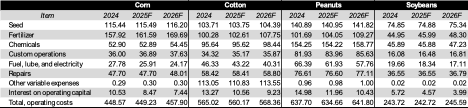
Unfortunately for producers, the recent decline in operating costs is likely to be temporary. Table 2 presents the ERS forecasts for corn, cotton, peanuts, and soybeans’ operating expenses in 2025 and 2026, alongside the 2024 cost estimates for comparison. The forecasts indicate that operating expenses will remain close to their 2024 level this year and are expected to rise slightly in 2026. Note that the commodity cost forecasts are reported at the national level rather than the regional level. However, regional and national trends are highly correlated in the ERS cost estimates. Therefore, it is reasonable that regional cost forecasts would resemble the national forecast provided by ERS.
Figure 1. Operating Costs ($/ac) for Selected Crops in Southern Regions, 2022-2024 and 10-Year Average
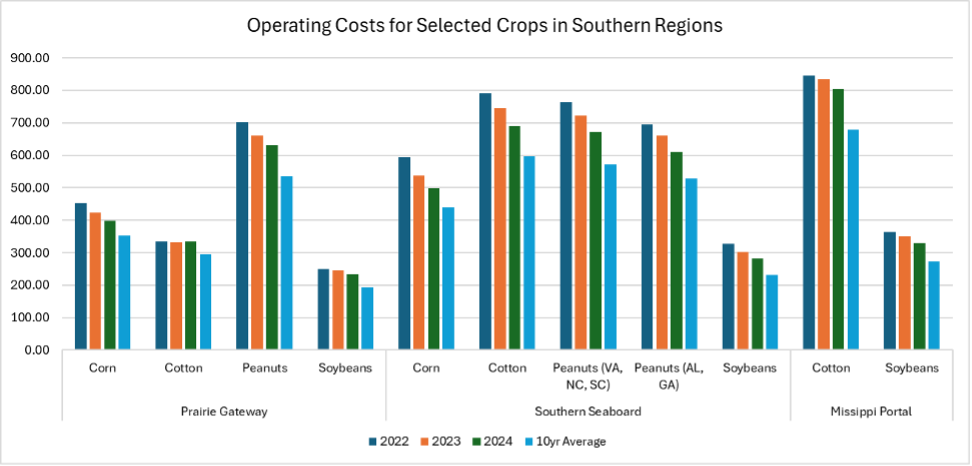
Table 1. Change in Operating Costs ($/ac), 2022-2024
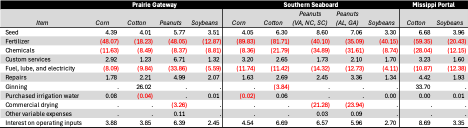
Table 2. Estimated and Forecasted Operating Costs, 2024-2026
[1] Operating costs for all crops include seed, fertilizer, chemicals, custom services, fuel/lube/electricity, repairs, purchased irrigation water, and interest on operating inputs. In addition, cotton operating costs includes ginning, and peanut operating costs includes commercial drying.
References and Resources
U.S. Department of Agriculture, Economic Research Service. Commodity Costs and Returns data. https://www.ers.usda.gov/data-products/commodity-costs-and-returns/documentation
Wright, Andrew. “Recent Trends in Farm Operating Costs.” Southern Ag Today 5(28.1). July 7, 2025. Permalink
