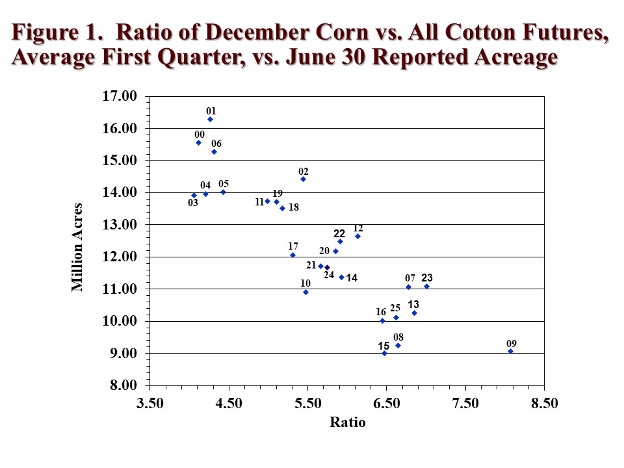
Longer run price outcomes for the 2026 crop will be influenced by expectations of supply and demand. A major supply-related question is how much 2026 acreage will be planted to cotton. The price of competing crops, relative to cotton prices, is an important consideration to the level of planted cotton acreage. Figure 1 shows a fairly strong relationship between the level of U.S. upland and pima cotton planted (as measured on June 30) and the ratio of December CBOT corn futures and ICE cotton futures during the first quarter of the year. The higher the ratio, the less cotton is planted.
Of course, there are other important competing crops as well, e.g., sorghum, soybeans, and peanuts. There are non-price influences, including how dry it is in Texas, the insurance base price, fixed cost influences, and the psychological influence of the preceding growing season. But the price ratio of corn to cotton appears to capture a lot of these other influences in explaining variations in cotton plantings.
What does Figure 1 imply for 2026? As of early August, the Dec’26 CBOT corn/Dec’26 ICE cotton price ratio is roughly 6.5 (i.e., $4.50 corn divided by 69-cent cotton). Assuming this ratio prevails during Q1 of 2026, it is historically associated with between 10.0 and 10.5 million acres of all cotton.
Assuming 10.0 million acres of all cotton in 2026, and further assuming ten-year Olympic averages of U.S. all cotton abandonment (21%) and yield (869 lbs) per harvested acre, the result is a healthy crop of 14.3 million bales. This combines with NASS’s August 12, 2025 projection of 3.6 million bales of carry-in for a 17.9 million bale supply. Further assuming 14.2 million bales of total use, the result is under four million bales of ending stocks of U.S. cotton in 2026/27. That outcome is neutral for prices as it represents static year-over-year ending stocks.
Caveats. Obviously, the analysis above depends on price ratios which may change between now and early 2026. Furthermore, the price ratio approach to forecasting planted acreage will be replaced by grower survey results, beginning at the Beltwide Conference (January 7) and continuing with the National Cotton Council’s survey release (February 9) and United States Department of Agriculture’s Prospective Plantings report (March 31) and Acreage report (June 30).
The National Oceanic and Atmospheric Administration’s Climate Prediction Center forecasts equal chances for continuing ENSO-neutral conditions or the development of La Niña conditions during the winter. The latter would imply more dryness and higher abandonment during 2026.
Historical June 30 planted all cotton acreage data from https://www.nass.usda.gov/Quick_Stats/
CBOT Dec corn and ICE Dec cotton futures settlements compiled from www.barchart.com
Robinson, John. “Next Year’s Cotton Market Possibilities.” Southern Ag Today 5(34.3). August 20, 2025. Permalink
