One of the questions that has been asked repeatedly lately is “how have we managed to keep beef production relatively high when we have the smallest cow herd since 1961?” The simple answer is “productivity.” The cattle industry produces more beef per cow than ever before. Productivity changes are also occurring in the production of pork and lamb. This SAT article examines production per breeding animal for cattle, hogs, and lambs, with differing reasons in each sector. We’ll follow up on poultry and dairy in a later article.
Cattle and Beef
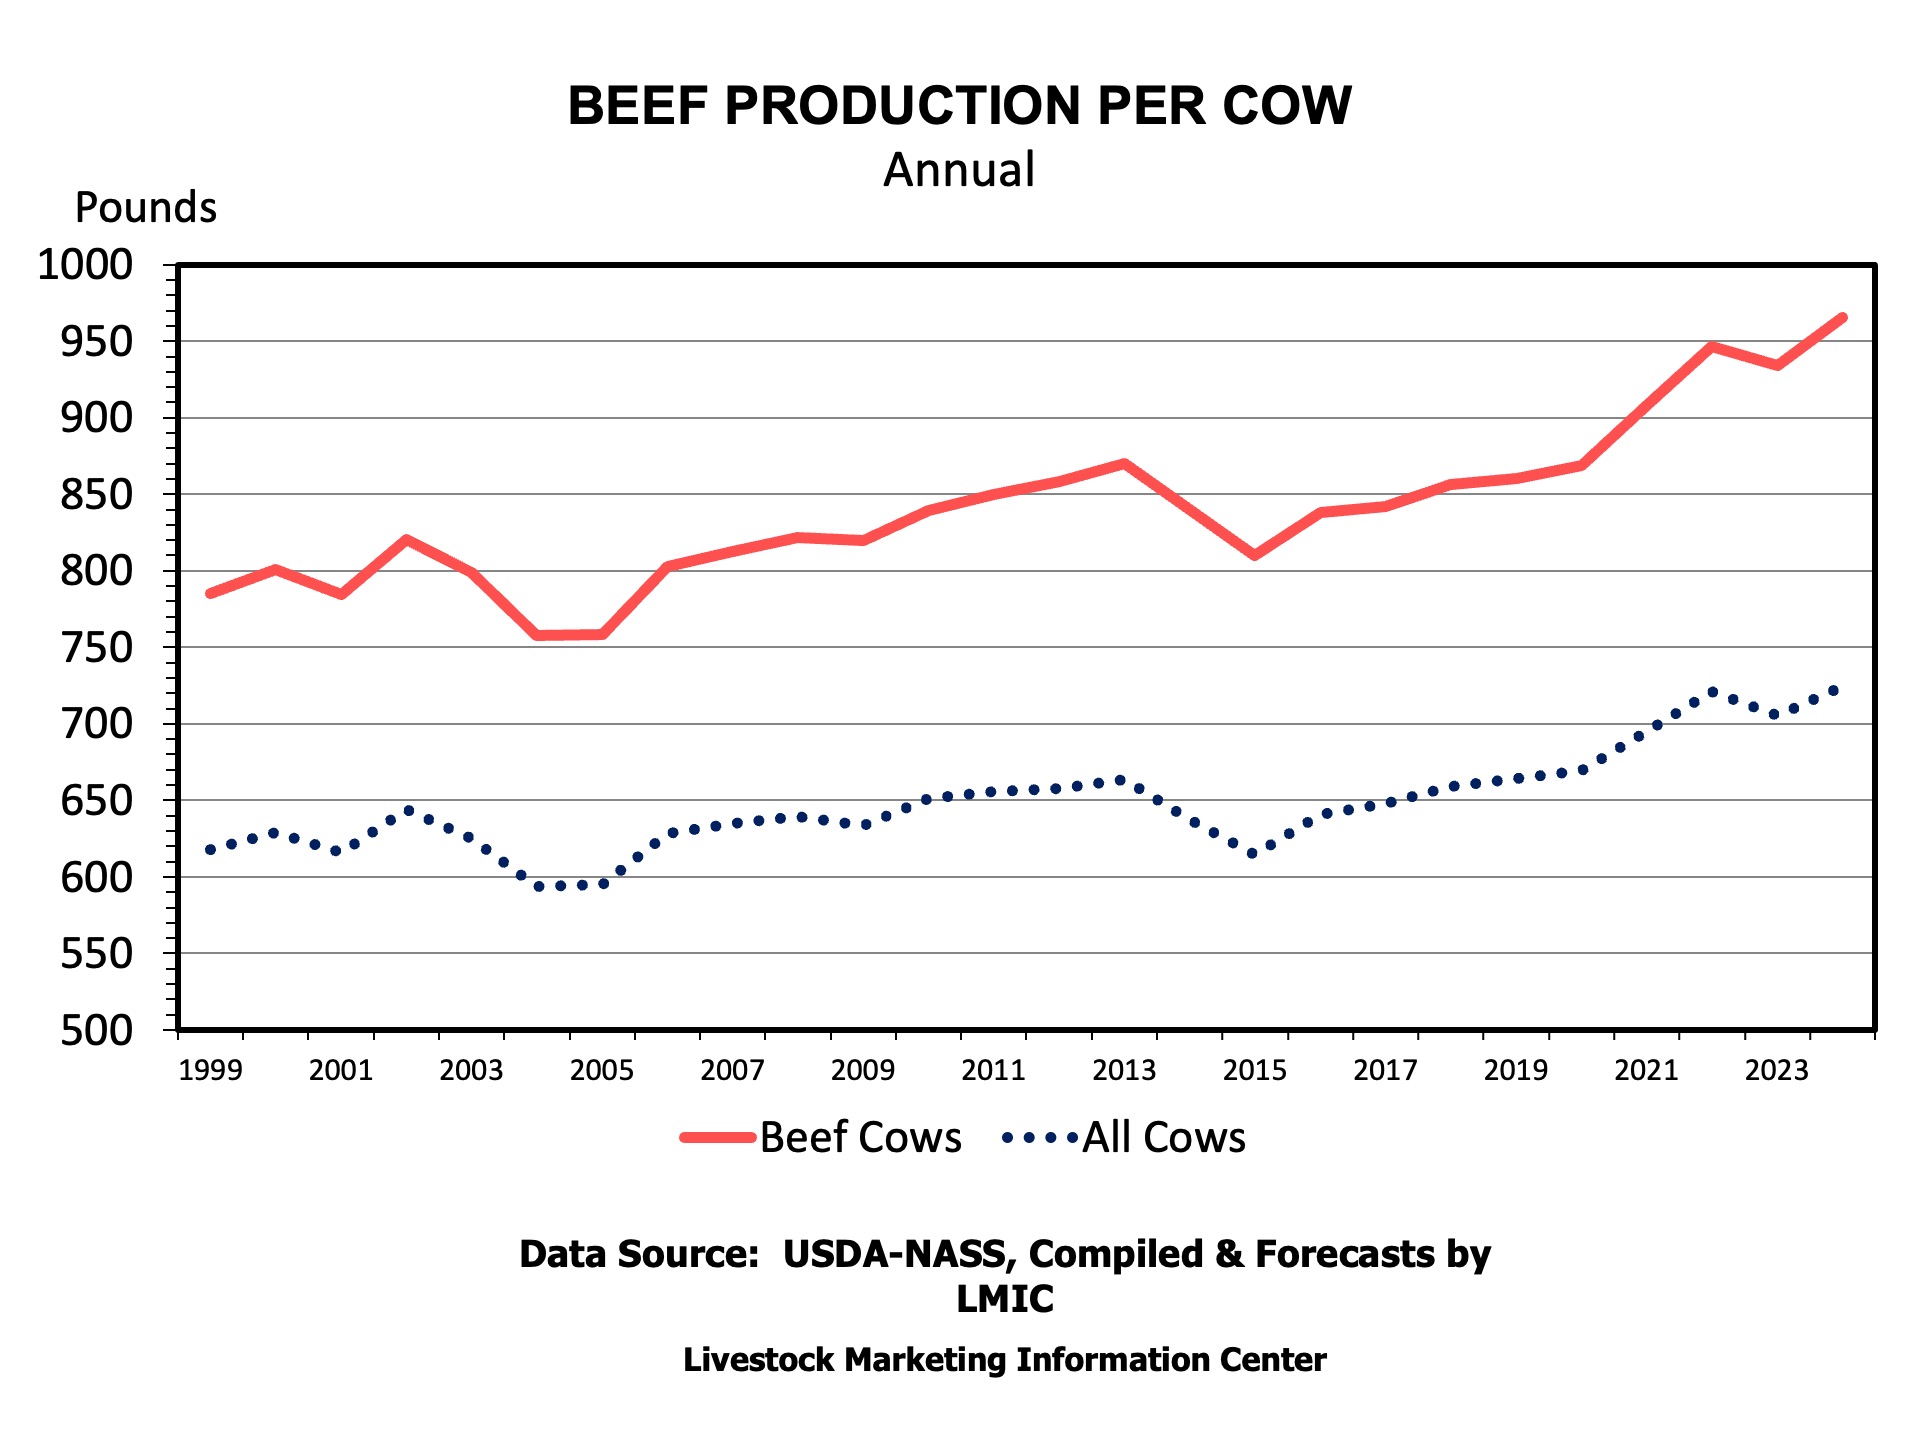
Beef production per cow has, generally, increased during this century. Whether measured by production per beef cow or production per all cows (which includes dairy cows), there is an upward trend. The cattle cycle impacts production measures when herd expansion reduces beef production due to heifers and cows being held back. Beef production per all cows has increased from 629 pounds per cow in 2000 to 724 pounds in 2024. The growth in production per cow is even more dramatic if measured by beef cows only, where production per cow has increased from 166 pounds per cow to 966 pounds in 2024.
Increasing beef production per cow has come, largely, from increased weights. Dressed weights for fed steers and heifers have steadily increased for many years. There is less evidence of changes in calving rates boosting productivity over the last 25 years.
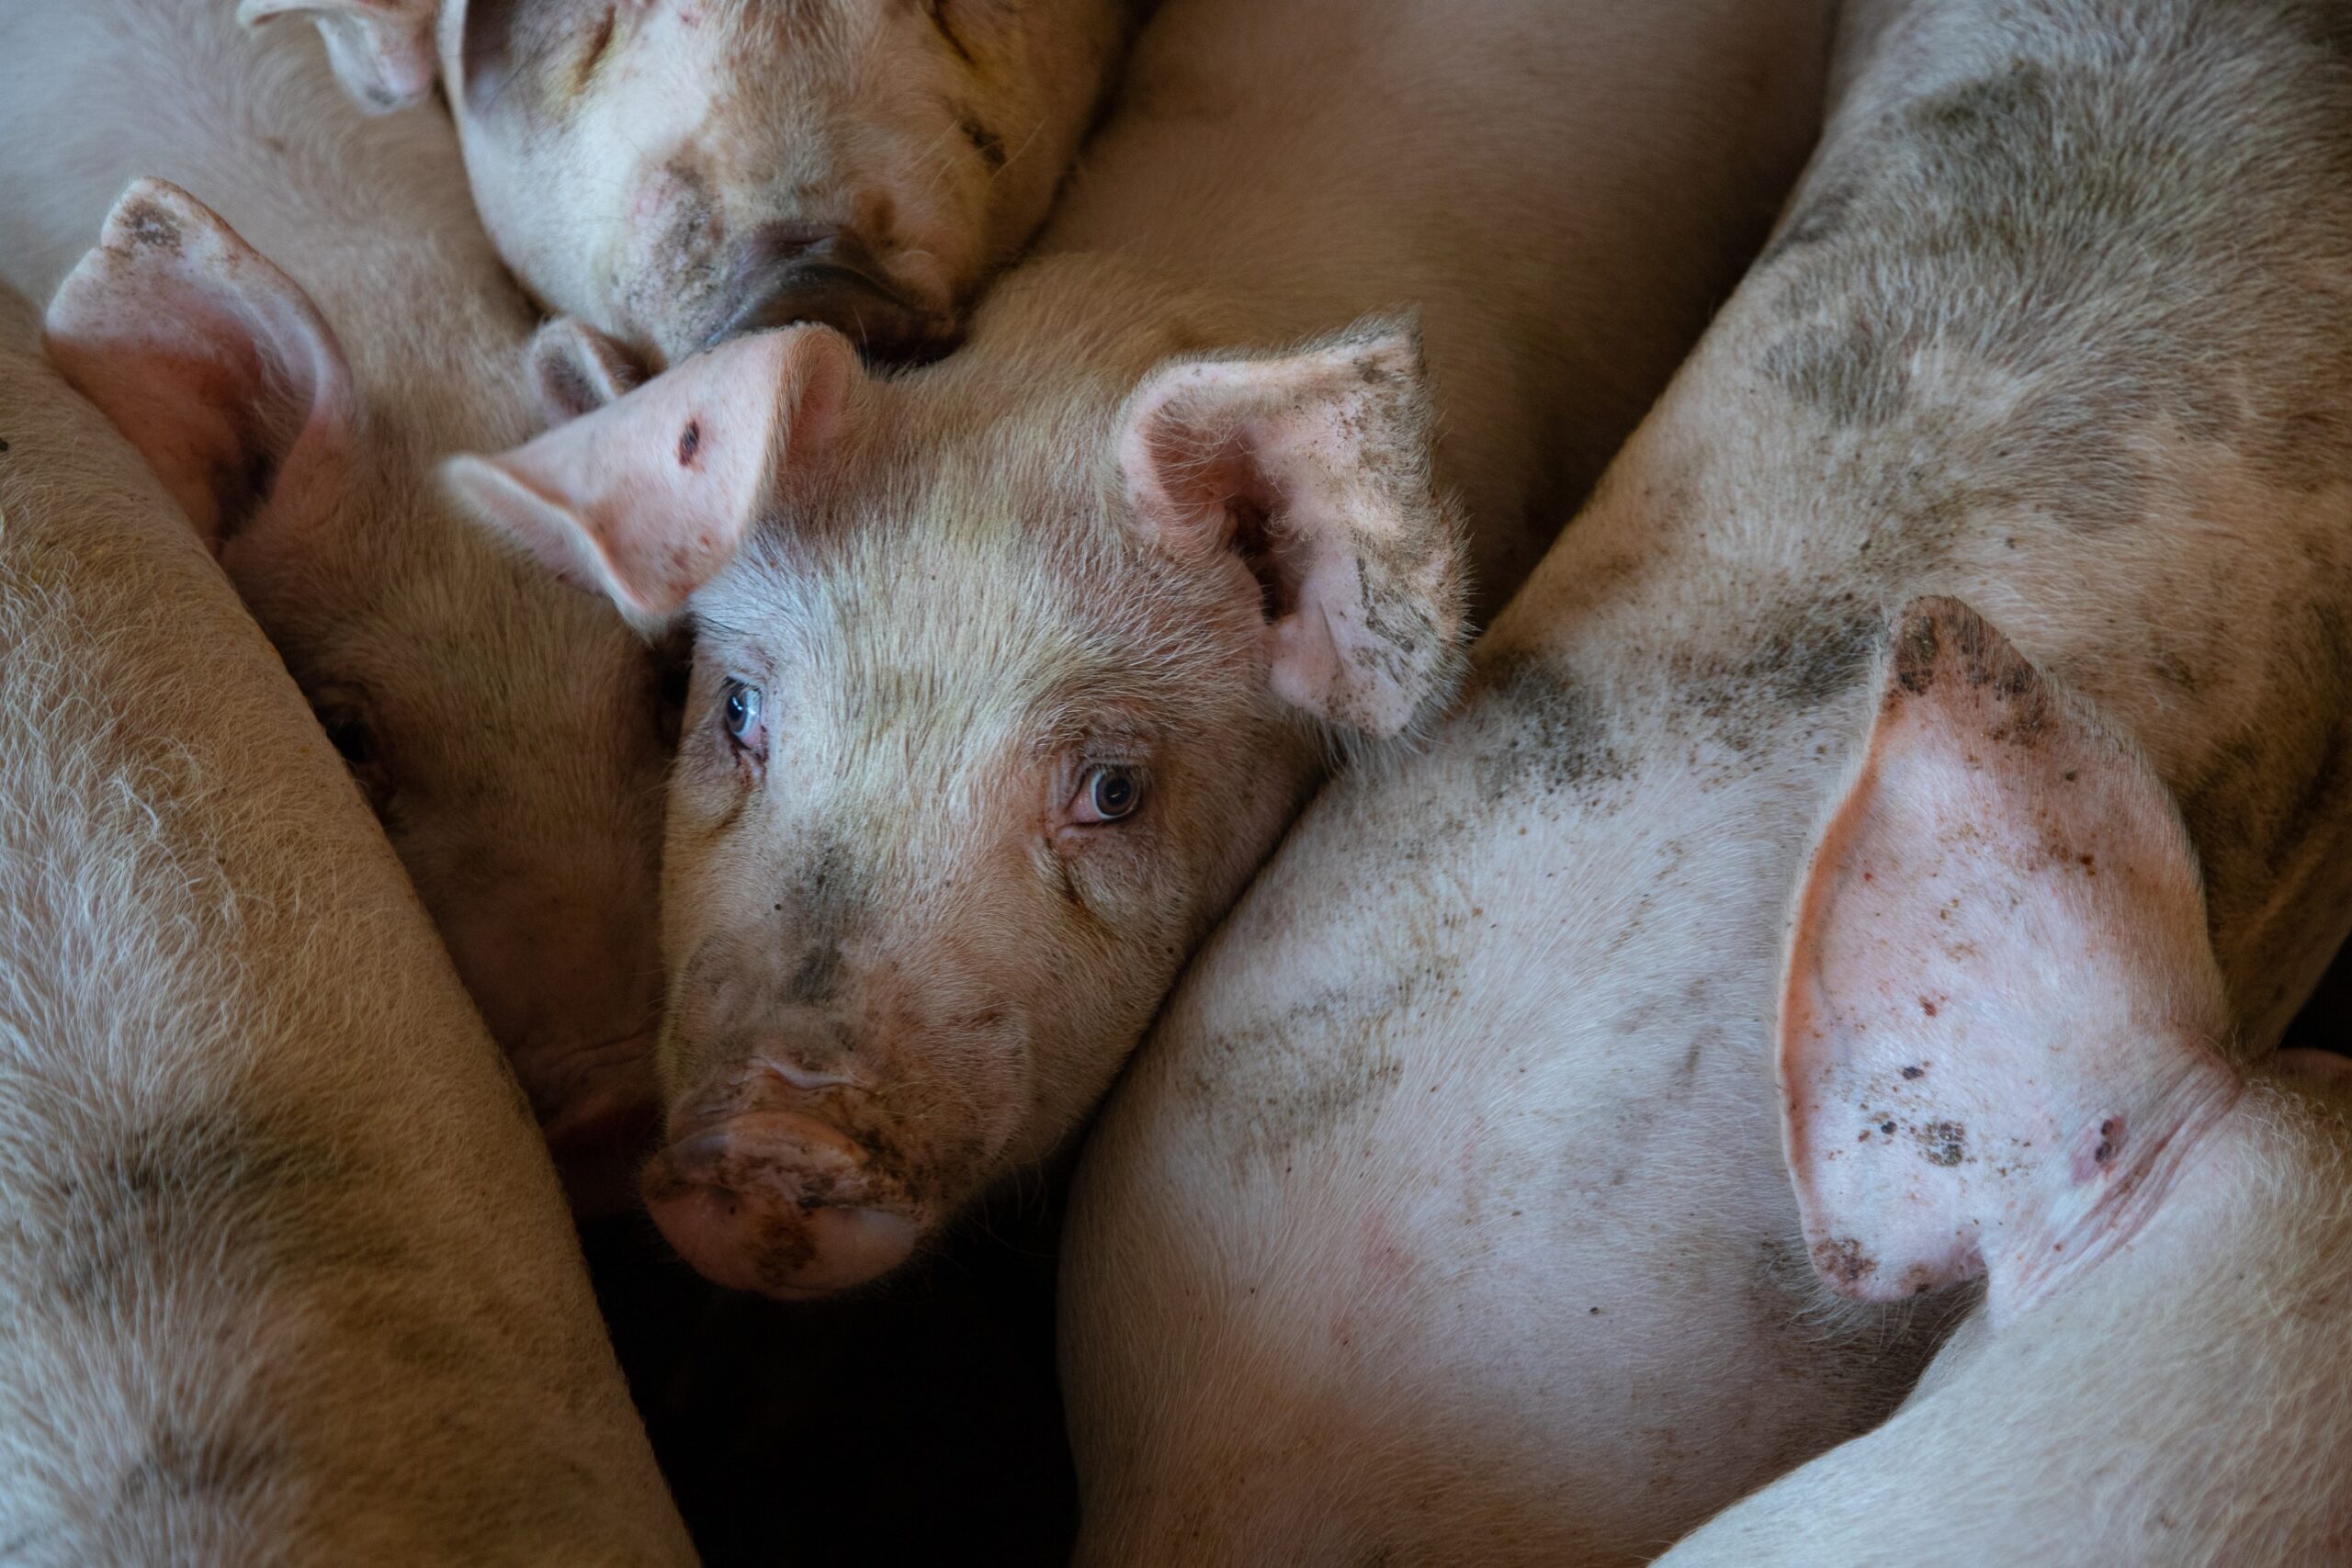
Hogs and Pork
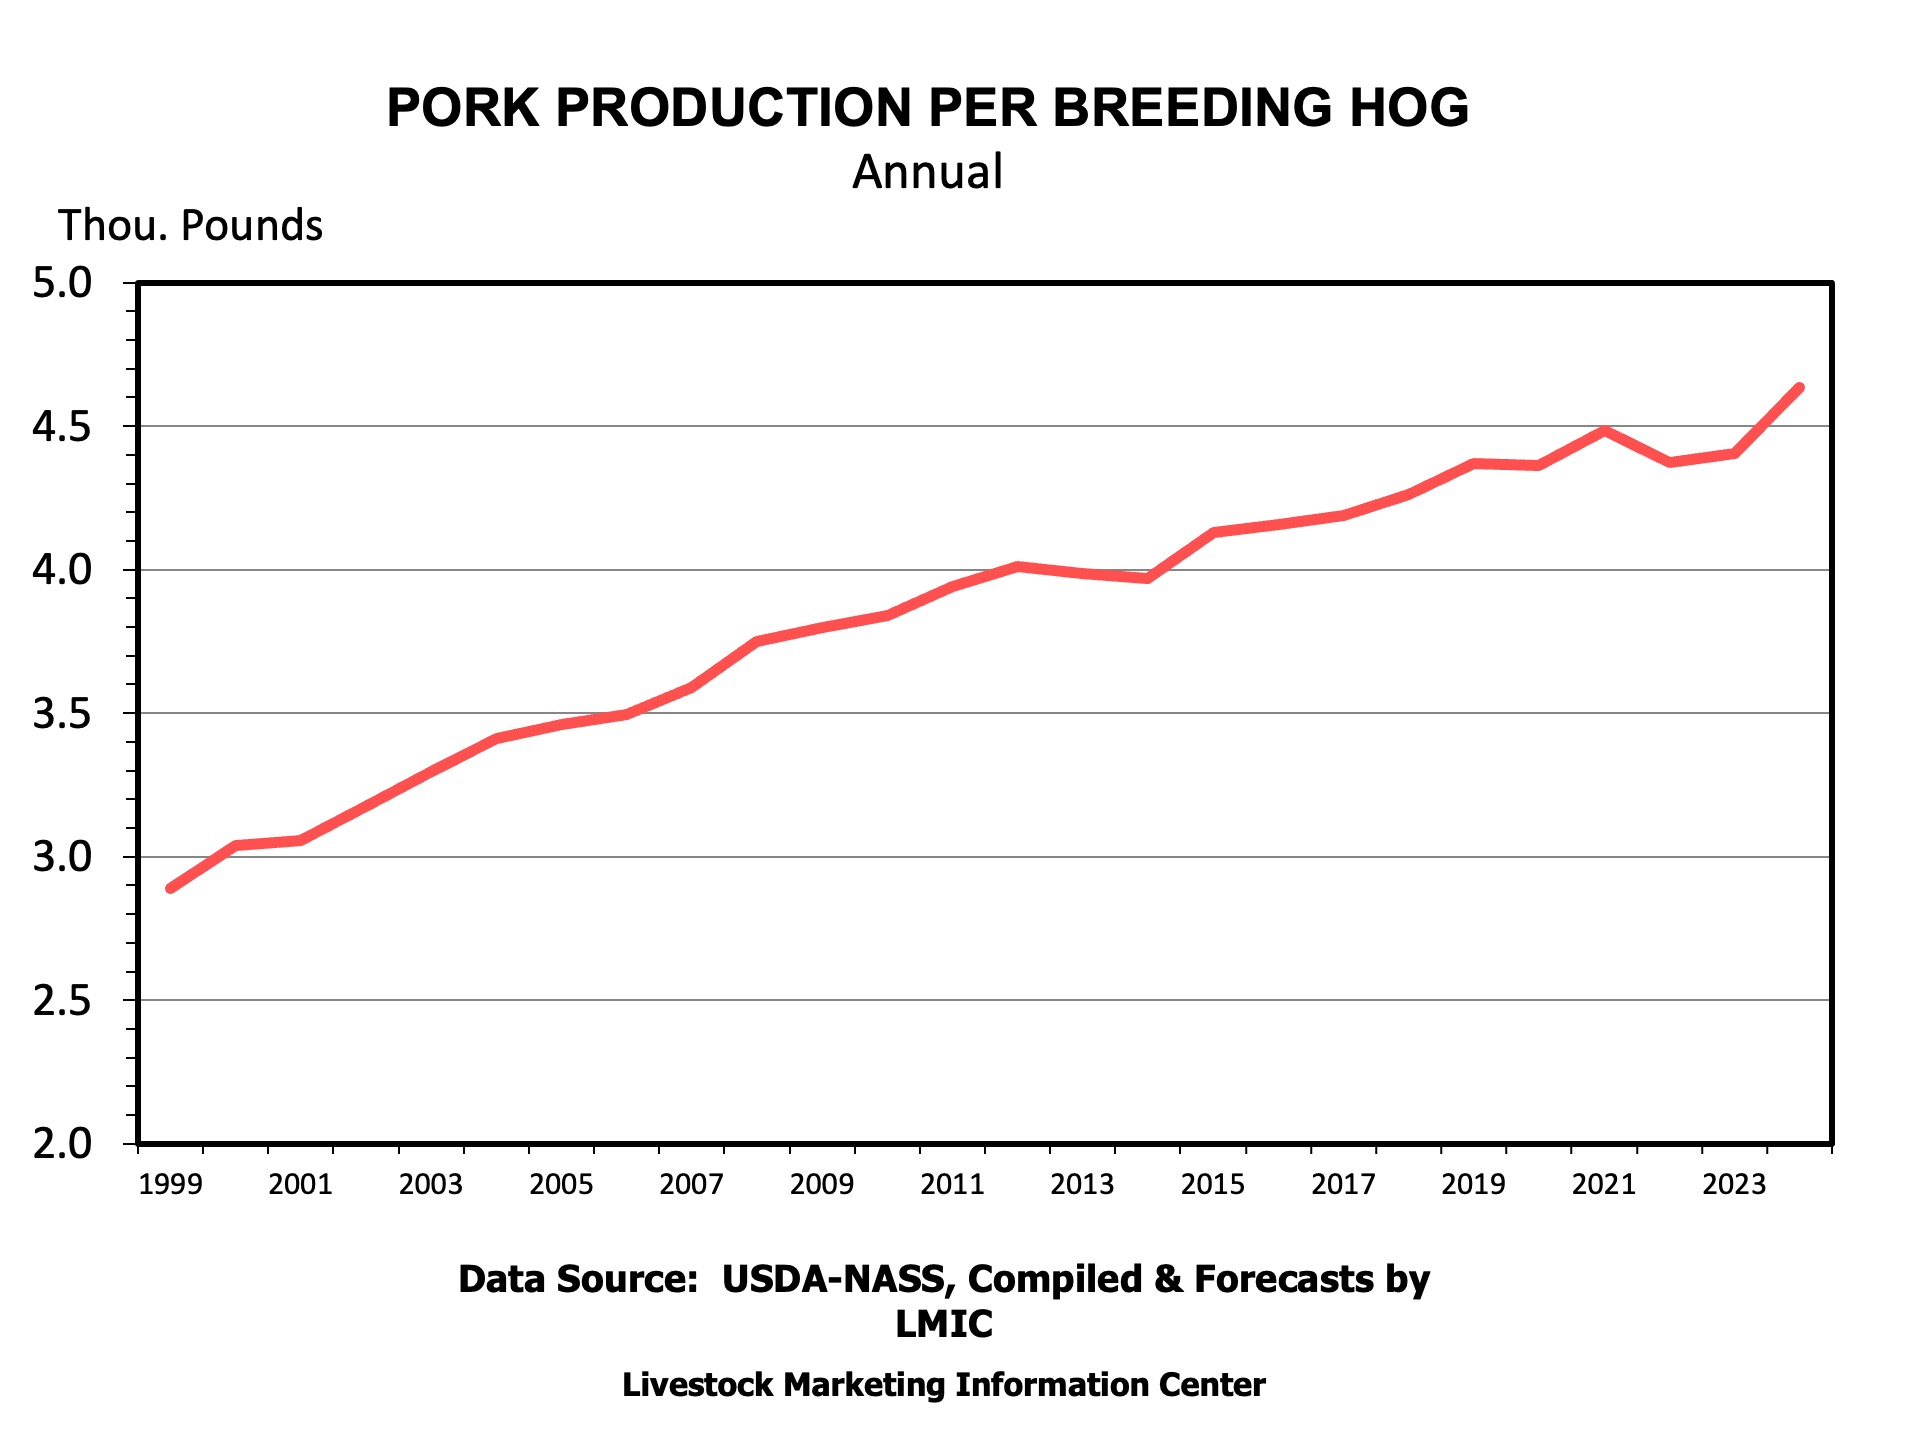
Pork production per sow has increased rapidly throughout this century, going from 3,041 pounds in 2000 to 4,635 pounds per sow in 2024, an increase of 52 percent. In contrast to beef per cow, production per sow gains have come from rapid gains in pigs per litter, and litters per sow per year, along with weights. Barrow and gilt dressed weights have increased from about 190 pounds per head in 2000 to an average of 212 pounds per head in 2024. Pigs per litter have increased from 8.8 in 2000 to about 11.8 in 2024, while litters per sow per year have grown from 1.8 to about 1.94 over the same time period.
In recent years, litters per year per sow and weights have declined while the number of pigs per litter has continued to grow. Disease events like Porcine Epidemic Diarrhea (PEDv) reduced pork production per sow.
Lamb
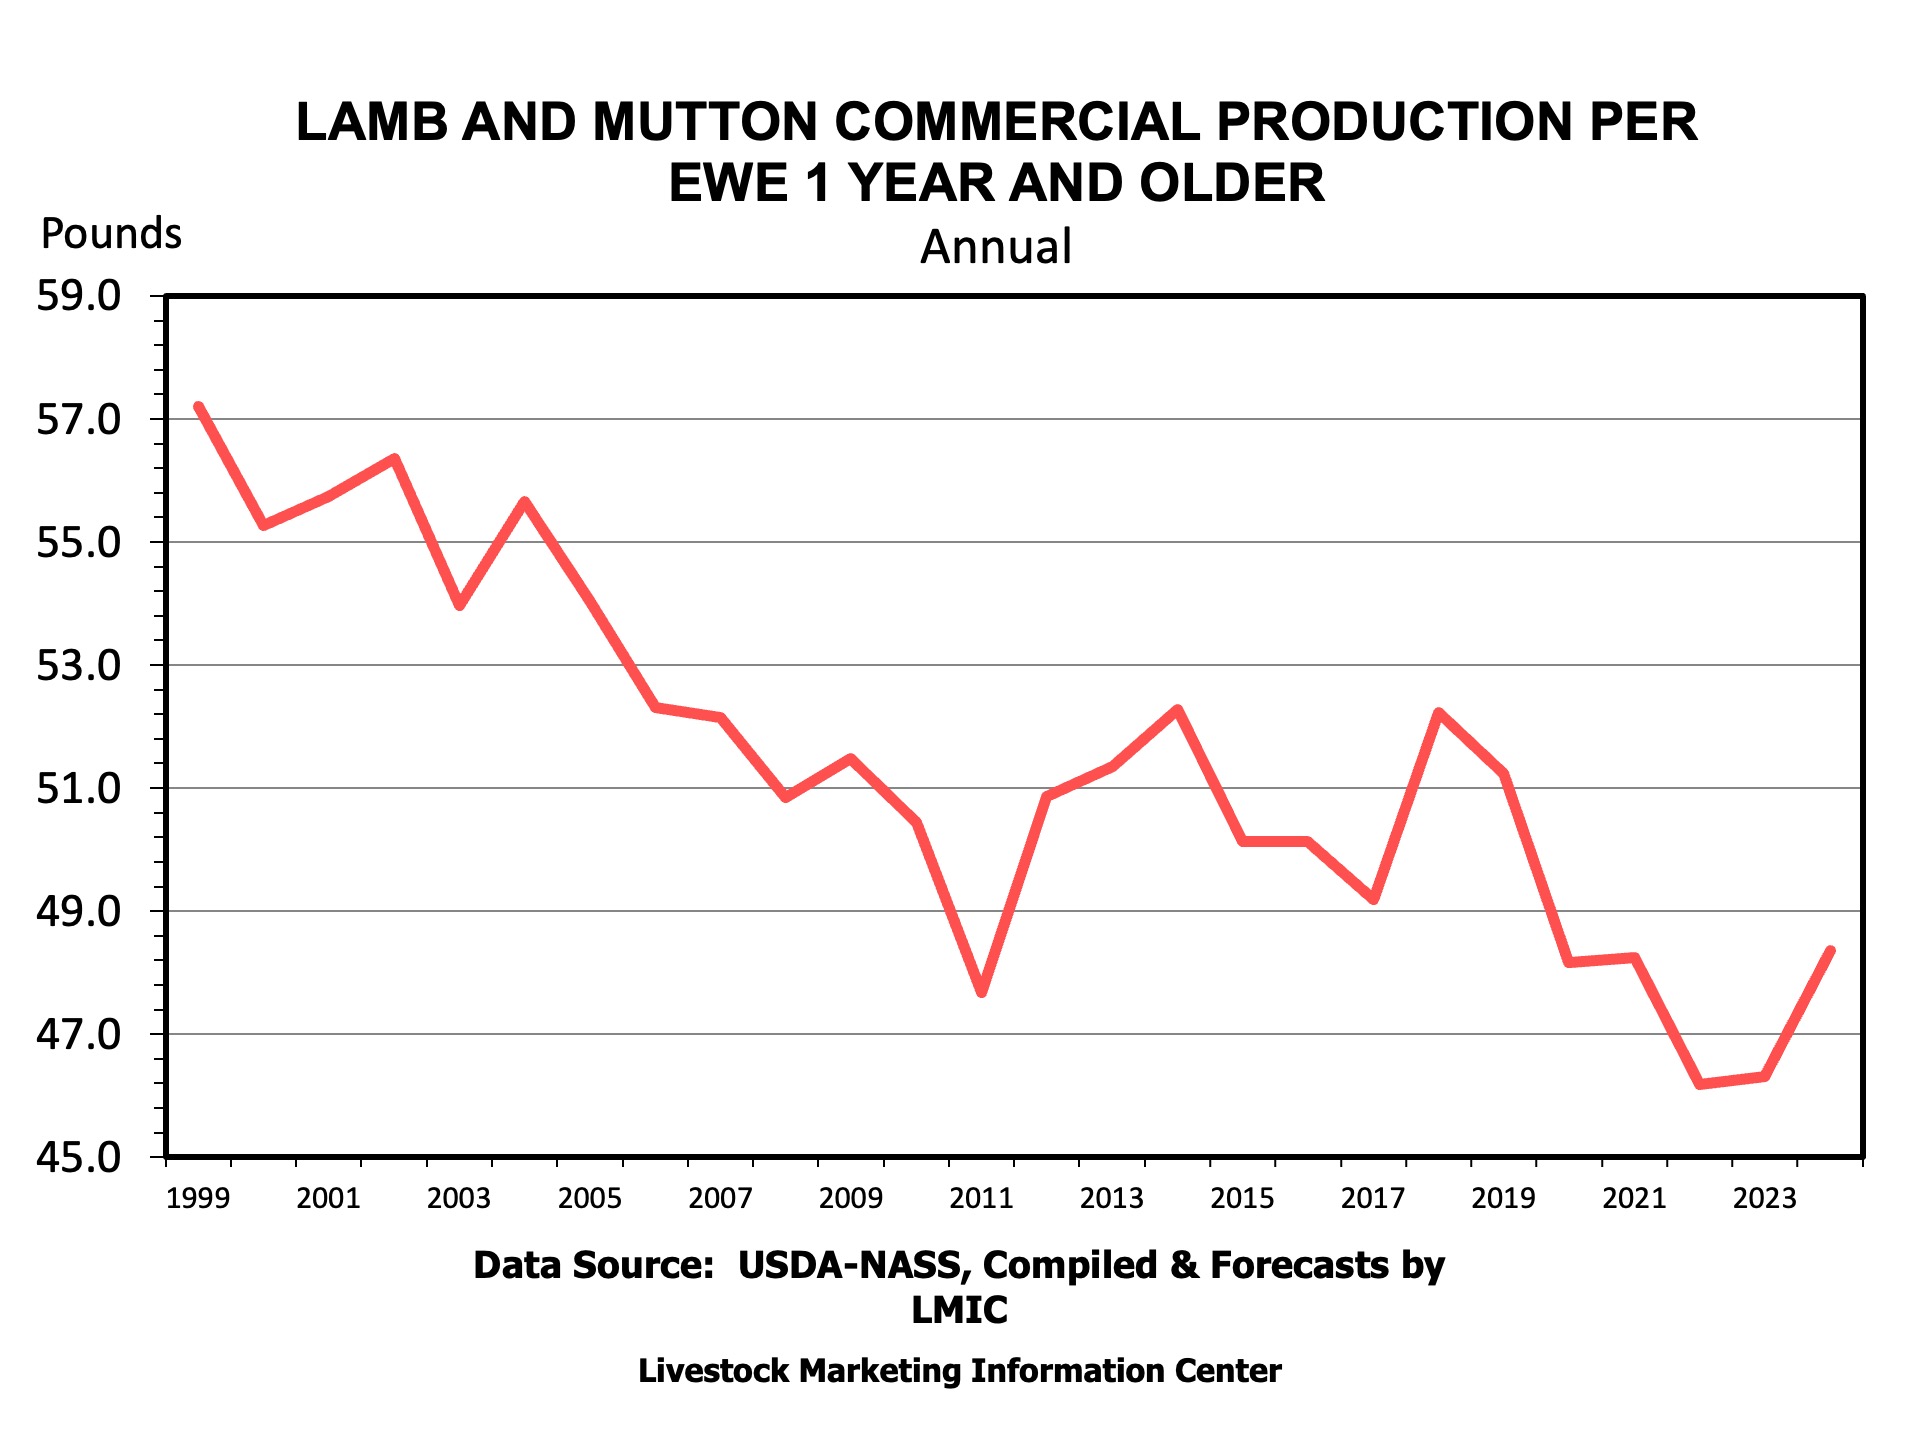
Lamb and mutton production per ewe tells an opposite story to beef and pork over this century. Production per ewe has declined from about 57 pounds per ewe in 2000 to 48 pounds per ewe in 2024. The decline in production per ewe is mostly attributable to declining dressed weights. The industry has experienced a dramatic change over time due to the emergence and growth of the non-traditional market, with many buyers desiring smaller carcasses. The growth of hair sheep breeds replacing many traditional wool breeds has also likely aided in that dressed weight decline.
Production per breeding animal is one way to look at productivity changes over time. Economic incentives, genetics, nutrition, animal health, and market changes have all been involved in changing productivity. Other efficiency measures could also be employed to examine productivity. But, this simple measure of pounds per breeding animal goes a long way in examining the changing structure of livestock industries.
Anderson, David, and Charley Martinez. “Productivity In Cattle, Hogs, and Lambs.” Southern Ag Today 5(37.2). September 9, 2025. Permalink

