Foreign workers hired under the H-2A Guest Farm Worker program are assured of being paid at least the Adverse Effect Wage Rates (AEWRs) determined through a federally designed mechanism. The AEWR determination process serves a two-fold objective: (1) to look after foreign workers’ welfare by assuring they are paid at just, fair wage levels and (2) to ensure that H-2A wages would not “adversely” affect U.S. farm labor market conditions, which could happen if such workers are paid at very low wages that could depress the domestic workers’ market wage rates.
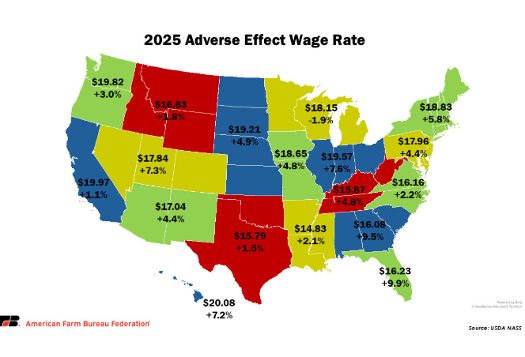
Except for AEWRs set monthly for range occupations (i.e. farms engaged in herding or livestock production operations performed on a range), the wages of the majority of H-2A hires are guided by a single annual rateprescribed for 18 farming territories – consisting of 3 states (California, Florida, and Hawaii) and 15 regions (Figure 1). Under existing H-2A program guidelines, the AEWR for the current year is derived from the average wage data collected by the National Agricultural Statistics Service (NASS) in the preceding year’s Farm Labor Survey (FLS). A singular state/regional AEWR for non-range field and livestock workers (for such farm work positions as graders, sorters, equipment operators, crop/nursery/greenhouse workers, ranch/aquaculture farm workers, packers, and packagers) is derived as the average of the FLS wage data for six Standard Occupational Classification (SOC) codes and titles.
Despite its economic and market arguments, the AEWR-setting mechanism often drew criticisms. Some contend that state/regional-level AEWRs could be too high. This especially applies to the last two years, when some farming territories experienced abrupt, radical spikes in their AEWRs. This year, the prevailing national AEWR is $17.74 per hour, which is 18.01% over the 2022 rate and translates to an annual average nominal growth of 5.68% over the last three years. This rate exceeds historical nominal AEWR growth trends estimated at only 3.52% between 1991 and 2022.
In understanding the H-2A affordability issue, the following issues need to be clarified.
- First, AEWR hikes are market-determined and reflect the previous year’s elevated market equilibrium rates. It follows that higher AEWRs indicate an aggressive farm labor market, where domestic workers are paid higher wages for farm jobs.
- Second, the H-2A affordability issue under rising AEWRs becomes more concerning when the program’s mandated comprehensive compensation package is accounted for in the compensation equation. Calvin, Martin, and Simnitt (2022) estimate a 5% wage premium added to the AEWR when calculating total H-2A compensation. The suggested premium accounts for the mandated additional H2A fringe benefits (including housing, meals, transportation, and insurance) that could add $2.55 per hour in hourly wages but also considers offsetting employers’ benefits realized from non-payment of SS & unemployment taxes.
- Finally, there is the aggregation issue employed in the existing AEWR determination process. Geographic aggregation (AEWRs for 18 geographic entities) raises questions on whether an AEWR set for several states in a region accurately captures local labor market conditions at the state level.
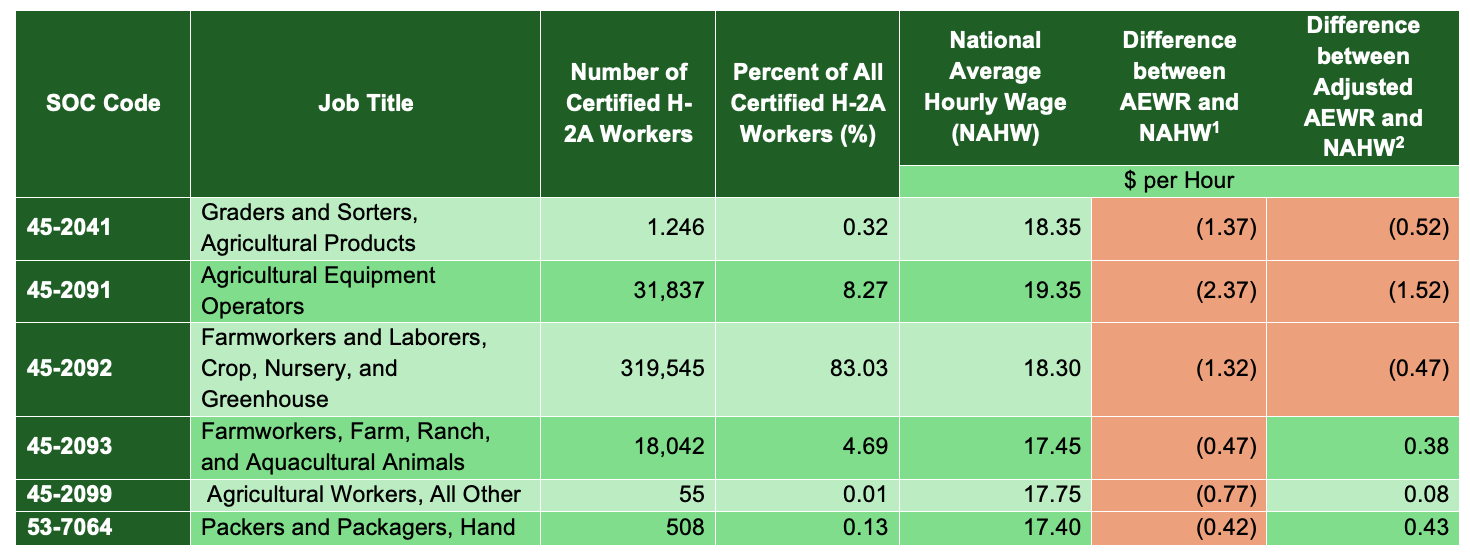
In this article, we investigate another form of aggregation that sets one AEWR for all types of jobs and industry employers based on wage data collected from a selected core of 6 SOC-classified jobs. Table 1 shows that the selected six SOC job titles comprise the bulk (96.46%) of all H-2A workers hired in 2024. The resulting differentials between the national average AEWR for 2024 ($16.98 per hour) and the average hourly wage for each SOC job category are all negative, thus establishing a cheaper H-2A hiring option since AEWR is consistently lower than all six domestic farm wage rates. When the H-2A mandated comprehensive remuneration package with fringe benefits is included in the equation (“adjusted AEWR” in Table 1), three negative wage differential results are registered (meaning H-2A labor is cheaper than domestic labor). Notably these negative results apply to three SOC job positions that comprise 91.62% of all H-2A hires in 2024.
All told, our analysis makes an important clarification on the affordability of H-2A workers. Our results indicate that at the national level, most U.S. farm employers of H-2A workers in 2024 find that such employment decisions have not been generally more costly than the domestic farm employment option. However, we qualify our deduction by clarifying that our analysis here is confined only to the aggregation of job categories and farm industries. Our further research in this area will attempt to validate if such trends in wage differentials and their implications on H-2A labor affordability persist at the state-level under more differentiated, localized farm labor market dynamics and conditions.
Figure 1. State and Regional Adverse Effect Wage Rates, 2025

Table 1. H-2A Employment, National Average Wages, and Wage Differentials Relative to AEWR under the Standard Occupational Classification (SOC) Codes Used in the AEWR Formula, 2024
| SOC Code | Job Title | Number of Certified H-2A Workers | Percent of All Certified H-2A Workers (%) | National Average Hourly Wage (NAHW) | Difference between AEWR and NAHW1 | Difference between Adjusted AEWR and NAHW2 |
| $ per Hour | ||||||
| 45-2041 | Graders and Sorters, Agricultural Products | 1.246 | 0.32 | 18.35 | (1.37) | (0.52) |
| 45-2091 | Agricultural Equipment Operators | 31,837 | 8.27 | 19.35 | (2.37) | (1.52) |
| 45-2092 | Farmworkers and Laborers, Crop, Nursery, and Greenhouse | 319,545 | 83.03 | 18.30 | (1.32) | (0.47) |
| 45-2093 | Farmworkers, Farm, Ranch, and Aquacultural Animals | 18,042 | 4.69 | 17.45 | (0.47) | 0.38 |
| 45-2099 | Agricultural Workers, All Other | 55 | 0.01 | 17.75 | (0.77) | 0.08 |
| 53-7064 | Packers and Packagers, Hand | 508 | 0.13 | 17.40 | (0.42) | 0.43 |
2 The 2024 AEWR is adjusted by a 5% incremental factor to account for H-2A’s mandated fringe benefits (housing, meals, transportation, and health insurance, among others)
Sources: USDA National Agricultural Statistics Service and Department of Labor
Table 1.(Image Format) H-2A Employment, National Average Wages, and Wage Differentials Relative to AEWR under the Standard Occupational Classification (SOC) Codes Used in the AEWR Formula, 2024

References:
Calvin, L., P. Martin, and S. Simnitt. (2022). Adjusting to Higher Labor Costs in Selected U.S. Fresh Fruit and Vegetable Industries. EIB-235, Economic Research Service, U.S. Department of Agriculture, Washington, DC.
Escalnate, Cesar L., Naimul Bhuiyan, and Joshua Emmanuel. “Understanding the H-2A Labor Affordability Issue.” Southern Ag Today 5(39.1). September 22, 2025. Permalink

