Recently, the Trump administration announced tariff exceptions on some agricultural products, including beef, tea and coffee, fruit juice, cocoa, spices, bananas, oranges, tomatoes, and certain fertilizers. Imports account for over ninety percent of consumption for four of these products: bananas, tea, coffee, and cocoa. Spices, tomatoes, and fruit juice also have import shares surpassing 60 percent. Meanwhile, consumption of beef and oranges have not been as reliant on imports, with a dependency totaling less than 20 percent of U.S. consumption. In 2024, the beef industry produced 12.4 million metric tons (MMT) of carcass weight equivalent beef, and the citrus industry grew 3.33 MMT of oranges. Of the 1.52 MMT of beef imports in 2024, ground beef made up nearly two-thirds at 981 thousand metric tons (TMT).
Figure 1: U.S. Import Share of Agricultural Products Relieved of Reciprocal Tariffs, MT, Five-Year Average 2020-2024
| Import Share | Production | Imports | |
| Beef* | 12.68% | 12,472,000 | 1,810,400 |
| Oranges | 17.11% | 3,332,304 | 687,805 |
| Fertilizer | 23.84% | 39,150 | 12,257 |
| Spices | 60.00% | 427,003 | 640,505 |
| Tomatoes | 69.93% | 864,162 | 1,981,046 |
| Fruit Juice** | 69.77% | 2,097415 | 4,840,255 |
| Cocoa | 99.00% | 14,240 | 1,409,748 |
| Coffee | 99.82% | 2,736 | 1,502,760 |
| Tea | 99.99% | 29 | 205,456 |
| Bananas | 100.00% | – | 5,121,292 |
*Beef is measured in carcass weight equivalent
** Fruit Juice Measured in kiloliters
Canada is the largest source of imported cocoa products and fertilizer for the United States, amounting to $2.77 billion and $4.73 billion, respectively, in 2024. Brazil is the leader in fruit juice exports to the United States at $1.14 billion. Mexico is the source of 85 percent of imported tomatoes, worth $3.12 billion, in the United States. Vietnam and India rank as the two leading sources of U.S. spice imports, $472 million and $410 million, respectively. As for tea, China ($118 million), Japan ($115 million), Canada ($107 million), and India ($92 million) each account for around 10 percent of U.S. imports. Brazilian coffee exports totaled $2.13 billion, and 21.6 percent of U.S. imports.
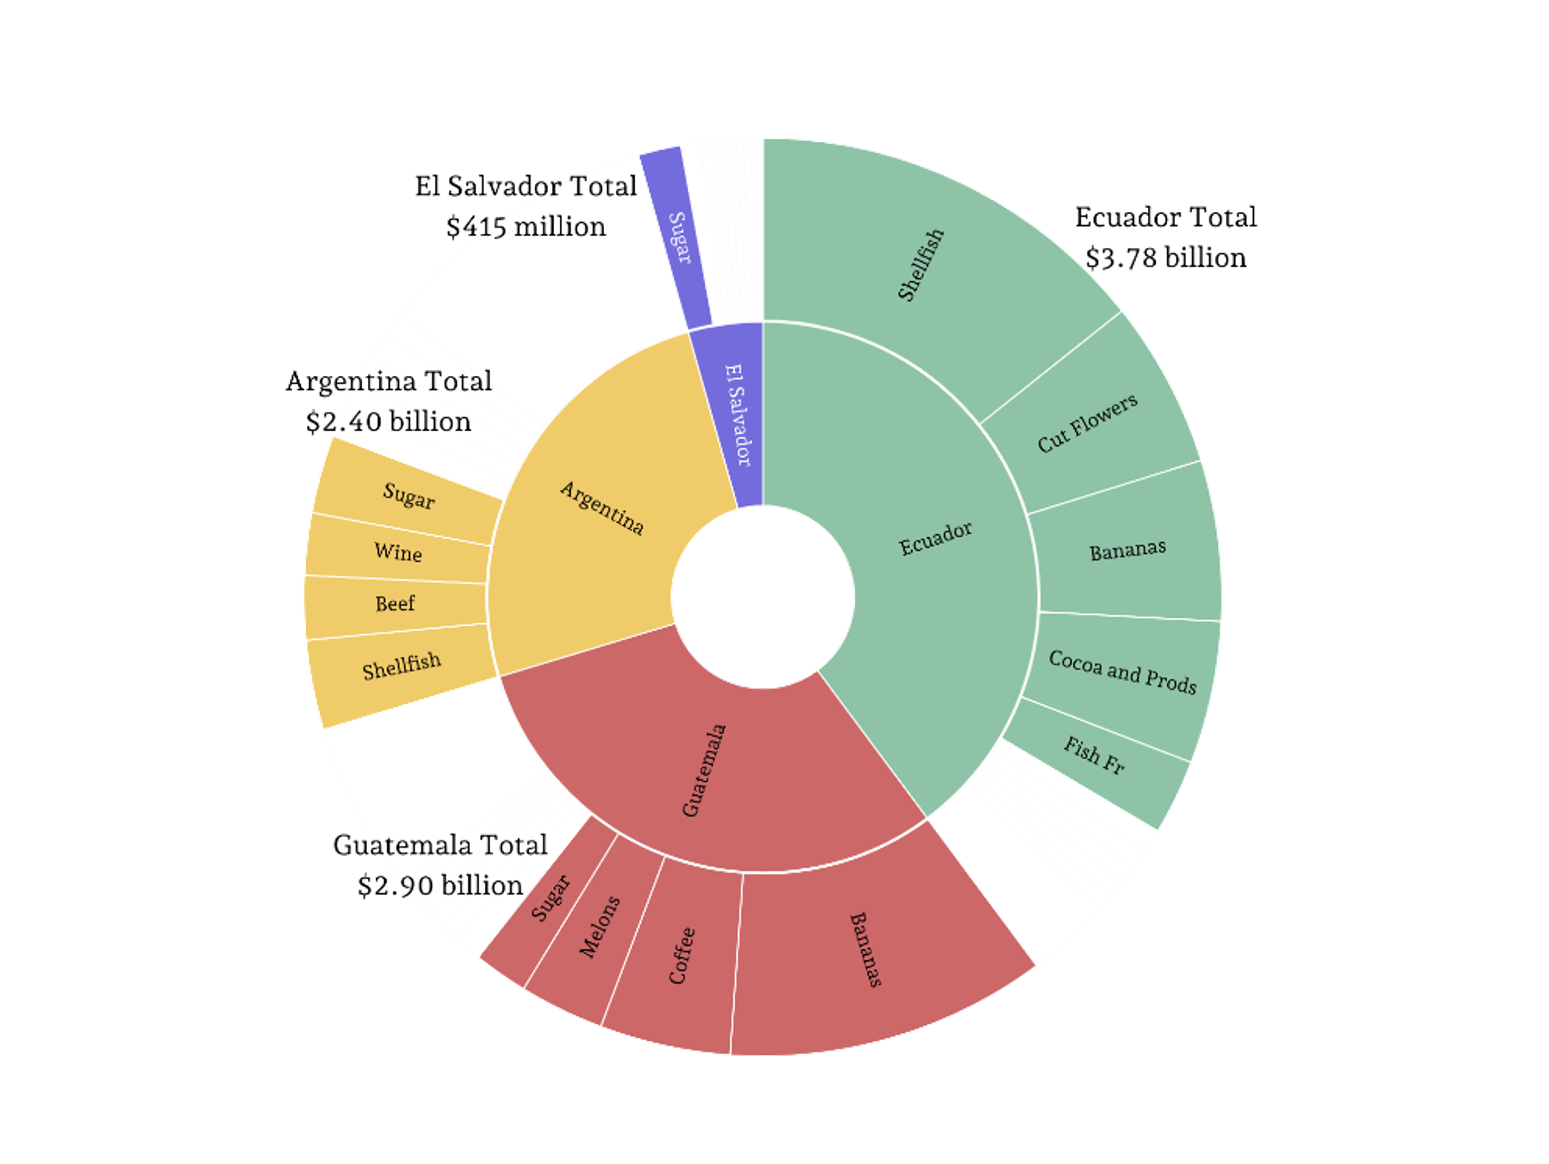
Additionally, the Trump administration has announced framework agreements with Ecuador, Guatemala, El Salvador, and Argentina, focusing on reciprocal trade and investment to boost market access and address non-tariff barriers. These agreements would remove the reciprocal tariff rate of 10 percent, 15 percent in the case of Ecuador, on the bulk of exported products to the United States from the respective country. In 2024, U.S. imports of agricultural products totaled $7.45 billion from the four countries. In 2024, imports from Ecuador totaled $3.78 billion with shellfish accounting for 35 percent of this total, with cut flowers, bananas, and cocoa each worth more than ten percent of the import value. Two products, bananas and coffee, made up more than half of the $2.9 billion imported from Guatemala. The $2.40 billion of imports from Argentina were mixed between a large group of items, with shellfish, beef, wine, and sugar making up 41 percent of the total. Finally, sugar and coffee were the leading products imported from El Salvador, together totaling $207 million of the $415 million in 2024.
Figure 2: U.S. Imports from Selected Countries, 2024
Sources:
Buzzanell, Peter J. Rex Dull, & Fred Gray. “The Spice Market in the United States: Recent Developments and Prospects.” July 3, 1995. https://ers.usda.gov/publications/pub-details?pubid=42049.
Economic Research Service (ERS). “Fruit and Tree Nuts Yearbook Tables.” Accessed November 2025. https://www.ers.usda.gov/data-products/fruit-and-tree-nuts- data/fruit-and-tree-nuts-yearbook-tables/. Published February 25, 2025.
Foreign Agricultural Service (FAS). “Global Fertilizer Dashboard.” Online Database. https://www.fas.usda.gov/data/visualization-global-fertilizer-trade-dashboard. Online public database.
Foreign Agricultural Service (FAS). Global Agricultural Trade System (GATS). Online database. https://apps.fas.usda.gov/gats/default.aspx. Online public database accessed November 2025.
Foreign Agricultural Services (FAS). Production Supply and Distribution (PS&D). Online Database. https://apps.fas.usda.gov/psdonline/app/index.html#/app/advQuery. Online public database
The White House. “Fact Sheet: Following Trade Deal Announcements, President Donald J Trump Modifies the Scope of the Reciprocal Tariffs with Respect to Certain Agricultural Products.” November 14, 2025.
Ribera, Luis, and Landyn K. Young. “Recent Tariff Exceptions and Trade Agreements Aimed to Reduce Food Costs.” Southern Ag Today 5(49.4). December 4, 2025. Permalink
