
Bart L. Fischer and Joe Outlaw
While farmers have been dealing with inflation in input costs since the onset of COVID-19, relatively high commodity prices (in large measure resulting from the war in Ukraine) helped blunt the pain through 2022. The perfect storm arrived as commodity prices started plummeting in 2023. Over the last 3 years—from 2023 to 2025—the losses have been piling up. As noted in Table 1, the average corn, soybean, and wheat producer has accumulated roughly $300 per acre in total losses over the last 3 years. For cotton producers, that estimate is roughly $1,000 per acre. After all their crops have been sold and all their bills have been paid, that’s how far in the hole they remain. Thankfully, the federal government has stepped in at various times to help. But, this all begs the question of what the net result over the last 3 years has been. This is especially the case as calls continue to circulate on Capitol Hill about the need for additional bridge assistance.
As noted in Table 1, Agriculture Risk Coverage (ARC) and Price Loss Coverage (PLC) provided little assistance for 2023 and 2024 largely because the reference prices had not been updated since the 2018 Farm Bill. While ARC and PLC will deliver significantly more assistance for the 2025 crop year—owing to improvements in the One Big Beautiful Bill from last summer—that assistance is not slated to arrive until later this year (October 2026). Congress also stepped up in December 2024 and created the Emergency Commodity Assisstance Program (ECAP), providing $10 billion in assistance for economic losses incurred in the 2024 crop year. More recently, Secretary Rollins announced an additional $11 billion for row crop producers via the new Farmer Bridge Assistance (FBA) program for economic losses incurred in the 2025 crop year.
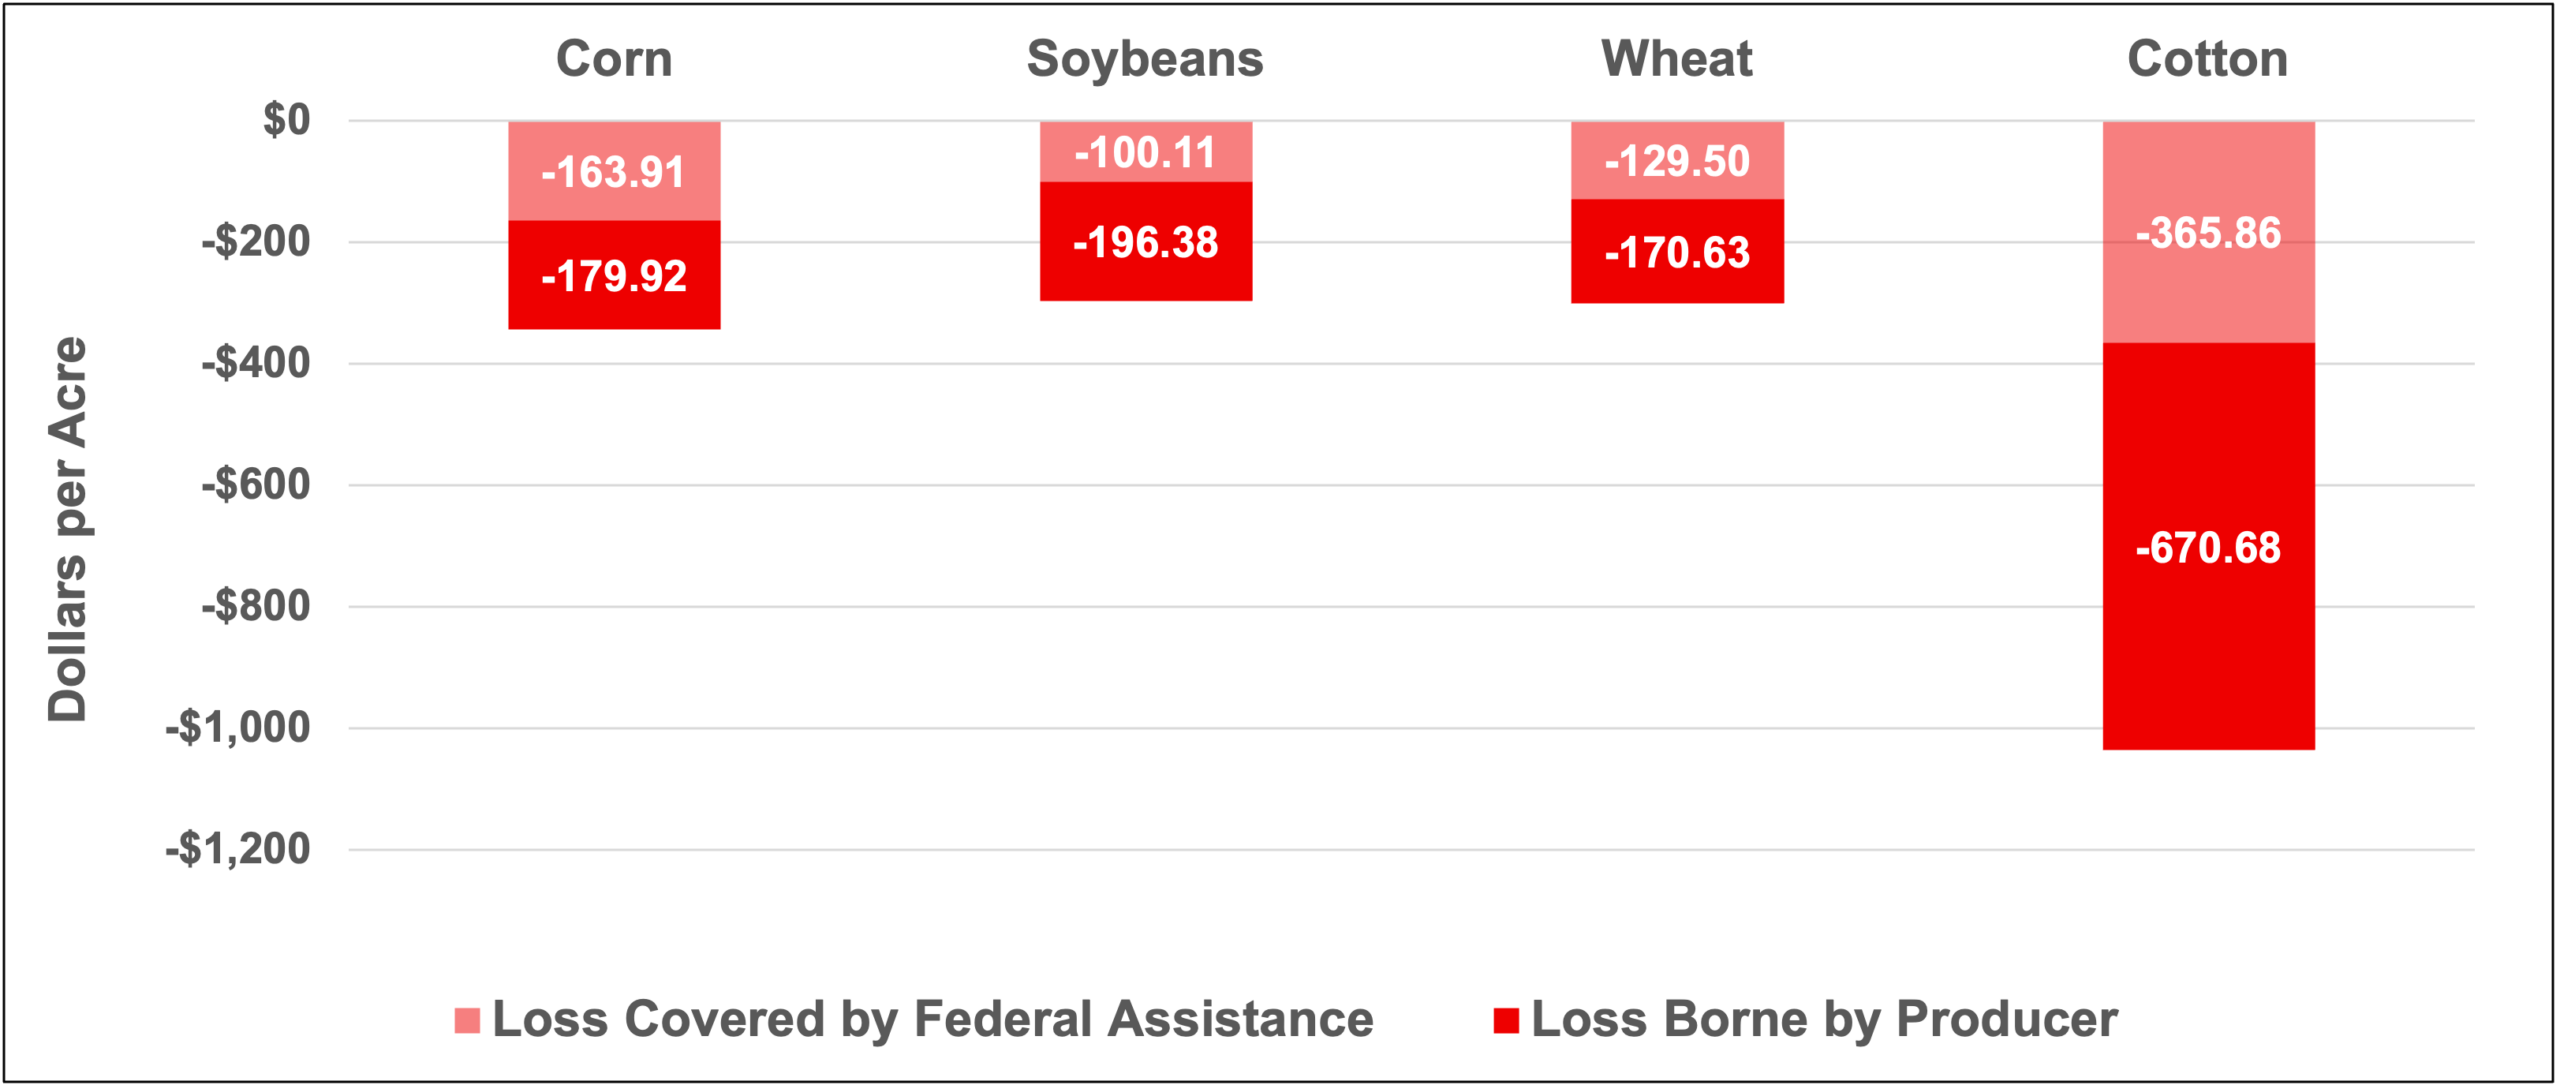
That is a tremendous amount of assistance. Is more really needed? While we will leave the question of “need” to policymakers to debate, we do offer the following observations. As reflected in Table 1 and Figure 1, despite all of the aid provided, we estimate that it is covering roughly 35% of the total loss for cotton and soybeans and roughly 45% of the loss for corn and wheat. In other words, farmers have had to shoulder roughly 55% to 65% of the loss on their own over the last 3 years. If nothing else, this should bring into focus the magnitude of the challenge they’ve been facing. Perhaps most daunting: they are facing a situation where the outlook suggests the losses will grow even larger next year.
Table 1. Cumulative Farm Losses for the Major Row Crops, 2023-2025F.
| 2023-2025F Cumulative Totals | Corn | Soybeans | Wheat | Cotton |
| Total Revenue ($/ac) | 2,333.29 | 1,675.04 | 883.67 | 1,760.67 |
| Total Cost ($/ac) a/ | 2,677.12 | 1,971.53 | 1,183.80 | 2,797.21 |
| Net Returns ($/ac) | -343.83 | -296.49 | -300.13 | -1,036.54 |
| ARC/PLC ($/ac) – 2023-24 Crop Years | 10.98 | 10.50 | 4.94 | 30.72 |
| ARC/PLC ($/ac) – 2025 Crop Year b/ | 65.66 | 28.97 | 54.52 | 133.05 |
| ECAP ($/ac) – 2024 Crop Year | 42.91 | 29.76 | 30.69 | 84.74 |
| FBA ($/ac) – 2025 Crop Year | 44.36 | 30.88 | 39.35 | 117.35 |
| Total Farm Bill & Ad Hoc Assistance ($/ac) | 163.91 | 100.11 | 129.50 | 365.86 |
| Share of Loss Covered by Aid | 48% | 34% | 43% | 35% |
Figure 1. Share of Cumulative Farm Losses for the Major Row Crops Covered by Federal Assistance and Borne by Producers, 2023-2025F.
Now, for a couple of technical points. First, some may ask why we didn’t include crop insurance indemnities or natural disaster aid (think the Supplemental Disaster Relief Program) in our analysis. The reason: our total revenue estimates in Table 1 use marketing year average prices and harvested yields. Our assumption is that any crop insurance indemnities or disaster aid payments simply help partially restore producer revenue. As a result, total revenue is an appropriate proxy. Second, some may ask why we focused only on the 4 major row crops with more than 10 million base acres. The primary reasons for this were that the ARC/PLC average payments are very sensitive to acreage assumed, and there is a significant difference between base and planted acreage for these smaller-acreage crops. While that will likely change with the new addition of base acres in the One Big Beautiful Bill, it remains a limitation for analyzing the 2023-2025 period that would likely skew our results. Further, for some of the smaller-acreage crops, payment limits are significantly binding. Without a reliable way to incorporate the effects of payment limits into this analysis, the estimated payments would be significantly over-stated. While some of these challenges also impact the major row crops, in our opinion, they are less pronounced. So, while we may follow up on this analysis in the future, for today we focused on the 4 major row crops.
Bottom line: for the major row crops, while the federal government has provided a significant amount of assistance, farmers are shouldering even more of the loss, and they are facing a growing season in 2026 that may well compound the loss even more. In dealing with the uncovered losses already incurred, producers have only so many options: (1) watch their equity erode in proportion to the losses they’ve faced; (2) to the extent that equity is gone they can [try to] borrow money to cover the losses; or (3) they go out of business. They are going through that mental math while also trying to cash flow the upcoming year.
One final point: we appreciate more than most the difficulty of getting anything done in Washington, D.C. We also encounter producers every day who are very grateful that policymakers have stepped up to the plate to help keep them on their farms during these very trying times. But, we’d be remiss if we didn’t also note that over the last 3 years, as a nation, we’ve essentially been asking farmers to put their livelihoods on the line – with very little hope for profits – to keep raising food and fiber…while hoping that the federal government will deliver relief at the 11th hour to help keep them there. One of us is married to a rocket scientist…but it doesn’t take a rocket scientist to know this isn’t sustainable.
Fischer, Bart L., and Joe Outlaw. “Is More Bridge Assistance Really Needed?” Southern Ag Today 6(6.4). February 5, 2026. Permalink
