Cattle prices have been supported by supply and demand fundamentals but, they’ve had to navigate several disruptive events, including the announcement by Tyson Foods of the closure of their Lexington, Nebraska packing plant, another Texas beef plant shifting to a single full-capacity shift, rising detections of New World Screwworm in Mexico (NWS), and political comments about boosting beef imports. Fundamental factors and disruptions carry important implications for regional cattle prices.
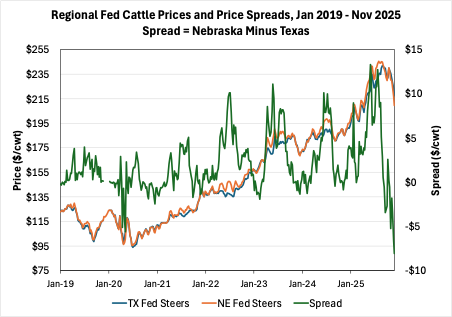
The closure of the Lexington, Nebraska, beef plant and reduced shifts in Texas represent a decline in demand for fed cattle in those regions and, all else equal, place downward pressure on prices. These changes in processing capacity also negatively affect feeder cattle prices, though that impact is lagged. The first graph shows the relationship between Nebraska and Texas fed steers sold live FOB. The spread (green line) is calculated as the Nebraska steer price minus the Texas steer price. A narrowing of the spread reflects stronger prices in Texas, while a widening of the spread reflects stronger prices in Nebraska.
Leading up to the plant closure announcement, we observe a sharp narrowing of the spread, indicating stronger prices in Texas relative to Nebraska that appears to extend beyond typical seasonal patterns. Historically, seasonality in the spread reflects relatively stronger Nebraska prices during the summer months, with prices more closely aligned in the fall and winter. It is important to note that this period was already characterized by extreme market volatility related to trade policy proposals and retail beef prices. It is difficult to disentangle the effects of beef plant closures from other sources of bearish market news. The key point is that a lot has occurred over a short period, all of which has implications for regional fed cattle markets.
More recent news related to New World Screwworm (NWS) has implications going back to fall 2024. Border closures restrict feeder cattle imports, tightening cattle supplies and supporting prices in Texas, while speculation about reopening the border would have the opposite effect and place downward pressure on prices.
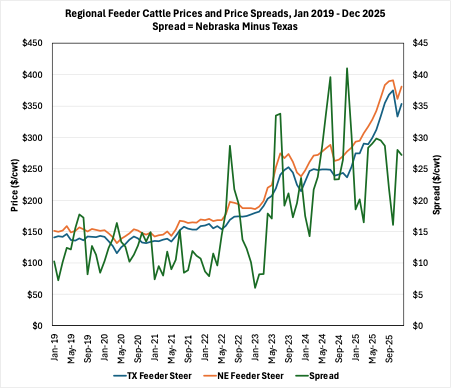
The second graph shows the monthly relationship between 700–800 lb. feeder steer prices in Texas and Nebraska. Monthly prices are used because weekly prices tend to be noisier. The spread is calculated as the Nebraska steer price minus the Texas steer price. As feeder cattle prices have trended higher overall, the magnitude of relative price movements between the two regions has also increased.
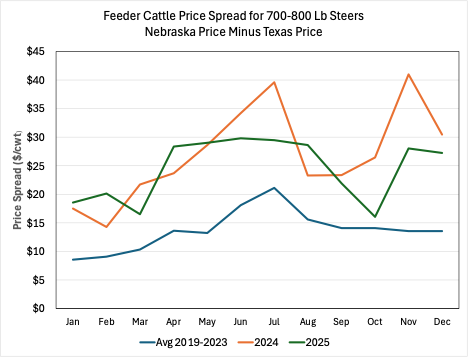
Comparing the Nebraska–Texas feeder steer price relationship (third graph) highlights a counter-seasonal pattern that has emerged in recent years. Feeder steer prices in Nebraska have been relatively stronger during the fall over the past two years compared to the previous five-year average. At the same time, the typical seasonal peak in the price spread during the summer of 2025 appears muted relative to both 2024 and the five-year average, which could be related to feeder cattle trade restrictions.
Taken together, recent movements in regional price spreads across feeder and fed cattle markets point to changes in how prices are adjusting across locations and stages of production. These observations are based on visual inspection of price relationships rather than formal analysis, and several factors could be contributing to the patterns shown. In feeder cattle markets, shifts away from typical seasonal patterns coincide with periods of trade-related uncertainty and tighter supplies, while fed cattle markets have also exhibited notable regional price movements coinciding with broader market volatility.
Mitchell, James. “Regional Cattle Price Spreads and Patterns.” Southern Ag Today 6(8.2). February 17, 2026. Permalink