
Authors: Yuri Calil and John Robinson
Cotton prices remain low and moving sideways. Nearby futures and U.S. spot stayed weak into early 2026 (about $0.63/lb). New-crop Dec’26 futures still carry about a $0.06/lb premium over nearby futures, signaling the market expects some tightening later in the year. The carry in the futures market is not a reason to plant more cotton. It reflects the market pricing in an expected supply contraction, not a demand-led recovery.
The global balance sheet explains why prices are stuck. For 2025/26, USDA projects 119.9 million bales of production and 118.7 million bales of mill use, raising ending stocks to 75.1 million bales. The U.S. picture is equally heavy: ending stocks reach 4.4 million bales, pushing the domestic stocks-to-use ratio to 32%, matching the highest level since the 2019/20 pandemic-era peak of 43%, with the season-average upland price lowered to $0.60/lb (USDA, 2026). High stocks slow any recovery unless demand surprises higher, which has not happened. This shifts attention to where supply cuts may emerge.
Exporter production signals are mixed, but the direction is clear (Figure 1). The United States projects 13.9 million bales in 2025/26, down 3.5%, with flat harvested area (7.80 million acres) and a yield-driven decline. Australia shows a sharper pullback: production drops 19.6% to 4.5 million bales, driven by a 21.7% area cut as the Murray–Darling Basin enters a second dry season. Brazil is the swing case where the USDA projects 18.75 million bales (+10.3%), while CONAB is lower at 17.47 million bales with area down 3.1% and a lower yield. Those differences matter because Brazil can set the marginal export tone.
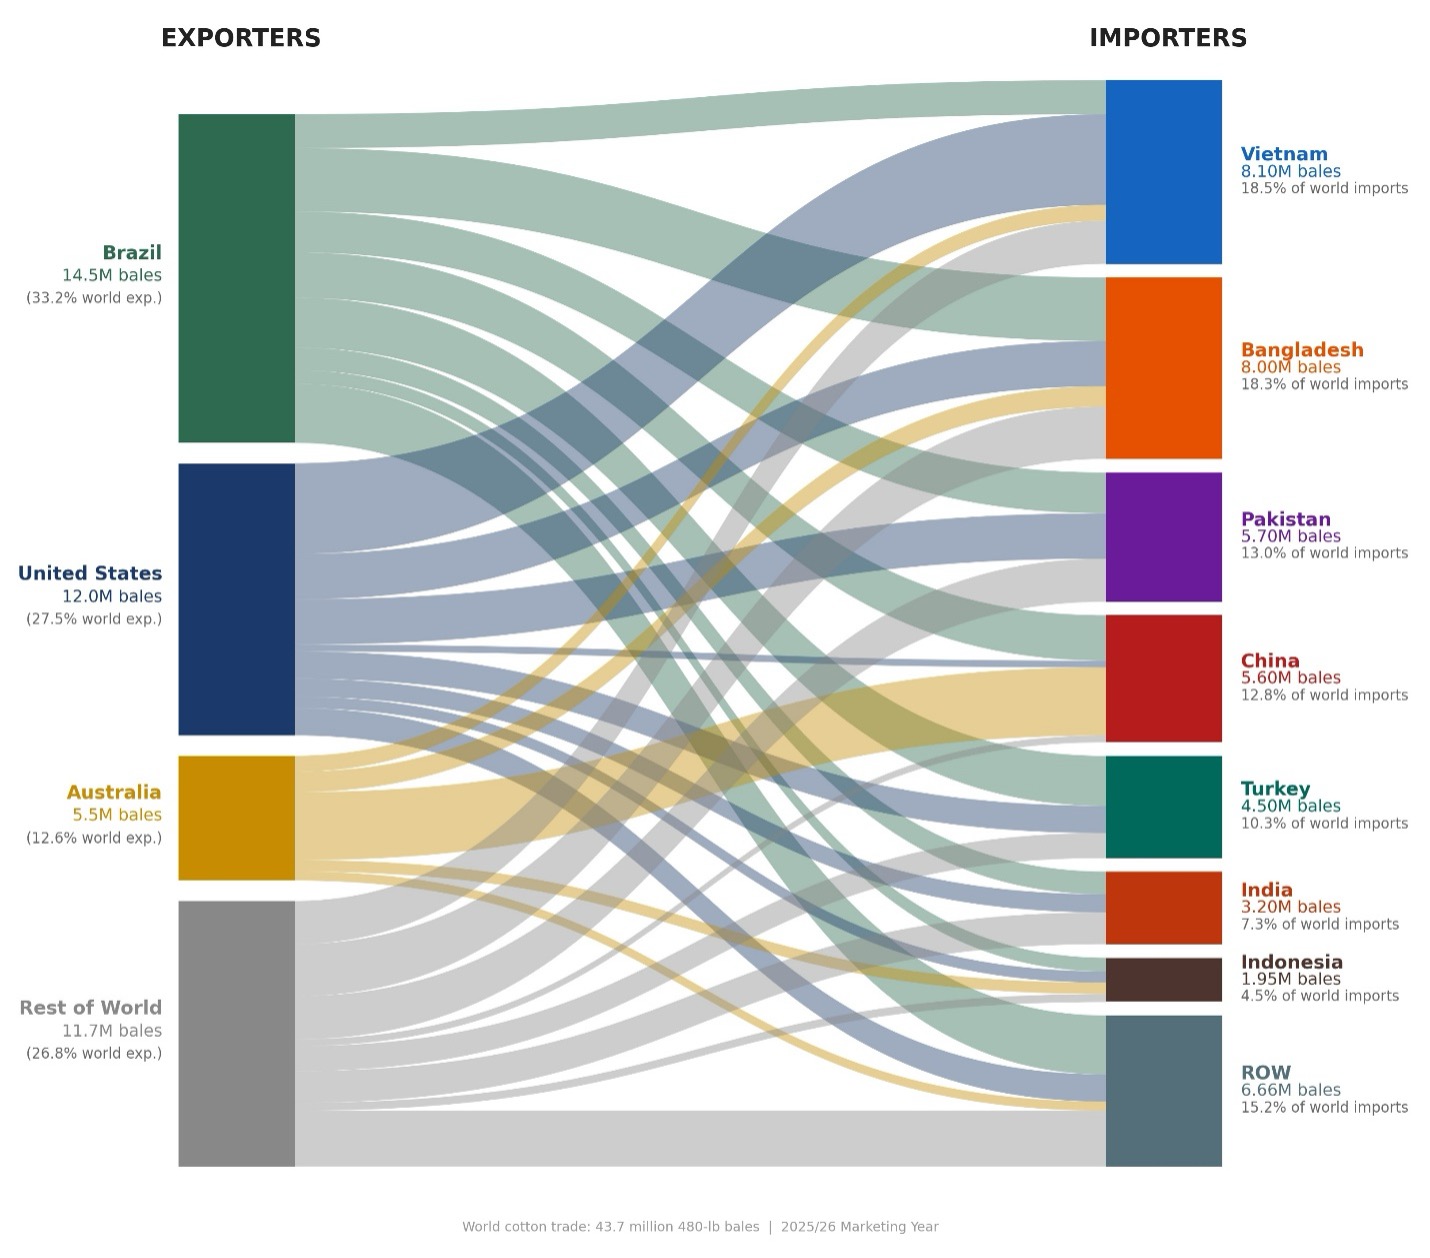
Trade is where price pressure shows up first. USDA puts 2025/26 world trade up slightly at 43.7 million bales. Within that total, origins are shifting (Figure 2). The U.S. is gaining ground in Vietnam, while trade developments increase sales prospects to Bangladesh and India. But China appears to lean more toward Australia; February updates cut U.S. exports by 200,000 bales while raising Australia’s by 200,000 bales (USDA, 2026). When buyers switch origins, basis, and export bids can move fast.
Acreage does not look like a bullish lever. The National Cotton Council projects 9.0 million cotton acres for 2026, down 3.2% from 2025 (NCC, 2026). Relative prices still favor competing crops, with the Dec’26 corn-to-cotton ratio near 6.7 points,[1] indicating flat-to-lower cotton acres, not expansion. Weather is the swing factor. NOAA expects La Niña to fade toward ENSO-neutral in Feb–Apr 2026 (60% chance), but parts of Texas entered late winter with drying soils and expanding drought, which can raise abandonment risk (NOAA CPC, 2026; USDM/NIDIS, 2026). If spring rains miss, supply could tighten into the new crop, consistent with the Dec’26 premium in futures.
For U.S. growers, the playbook stays defensive, but flexible. Growers may wish to consider using rallies to price a portion of expected production and protect downside risk. Brazil’s acreage follow-through should be monitored, as well as China’s import pace, because both variables can change export competition quickly. Marketing should be tied to your cost structure and moisture outlook, since yield risk can dominate net revenue.
Figure 1. Area vs. Yield: What’s Driving Exporter Production Shifts (2024/25 vs. 2025/26)

Figure 2. Cotton Trade: Major Exporters and Key Buyer Markets (2025/26)
[1] The December corn-to-cotton price ratio is calculated as the December Corn futures price (CBOT ZCZ26, $/bu) divided by the December Cotton No. 2 futures price (ICE CTZ26, ¢/lb). Because the contracts use different units, this ratio is a rule-of-thumb indicator of relative new-crop price incentives rather than a direct profitability comparison. It is best interpreted alongside expected yields, local basis, and per-acre variable costs when assessing acreage shifts.
References
Australian Bureau of Agricultural and Resource Economics and Sciences (ABARES). (2025, December). Agricultural commodities: December quarter 2025 (Report No. 216). https://www.agriculture.gov.au/abares/research-topics/agricultural-outlook/australian-crop-report
Companhia Nacional de Abastecimento (CONAB). (2026, February). Acompanhamento da safra brasileira de grãos: 5º levantamento, safra 2025/26. https://www.conab.gov.br/info-agro/safras/graos/boletim-da-safra-de-graos
National Cotton Council of America (NCC). (2026, February). 45th annual early season planting intentions survey. https://www.cotton.org/econ/cropinfo/cropdata/planting-intentions.cfm
National Integrated Drought Information System (NIDIS). (2026, January 22). Drought status update: Southern Plains. NOAA. https://www.drought.gov/drought-status-updates/drought-status-update-southern-plains-2026-01-22
NOAA Climate Prediction Center (NOAA CPC). (2026, February 12). ENSO diagnostic discussion. National Weather Service/NCEP. https://www.cpc.ncep.noaa.gov/products/analysis_monitoring/enso_advisory/ensodisc.shtml
U.S. Department of Agriculture, Agricultural Marketing Service (USDA AMS). (2026, February). Cotton market news — daily settlement prices. https://www.ams.usda.gov/market-news/cotton
U.S. Department of Agriculture, Foreign Agricultural Service (USDA FAS). (2026, February). Cotton: World markets and trade. https://fas.usda.gov/data/cotton-world-markets-and-trade
U.S. Department of Agriculture, World Agricultural Outlook Board (USDA WAOB). (2026, February 10). World agricultural supply and demand estimates (WASDE-668). https://www.usda.gov/oce/commodity/wasde/wasde0226.pdf
Cali, Yuri, and John Robinson. “Global Stocks Are Up, Exporters Are Cutting Back, and U.S. Cotton Faces a Tough 2026.” Southern Ag Today 6(9.3). February 25, 2026. Permalink
