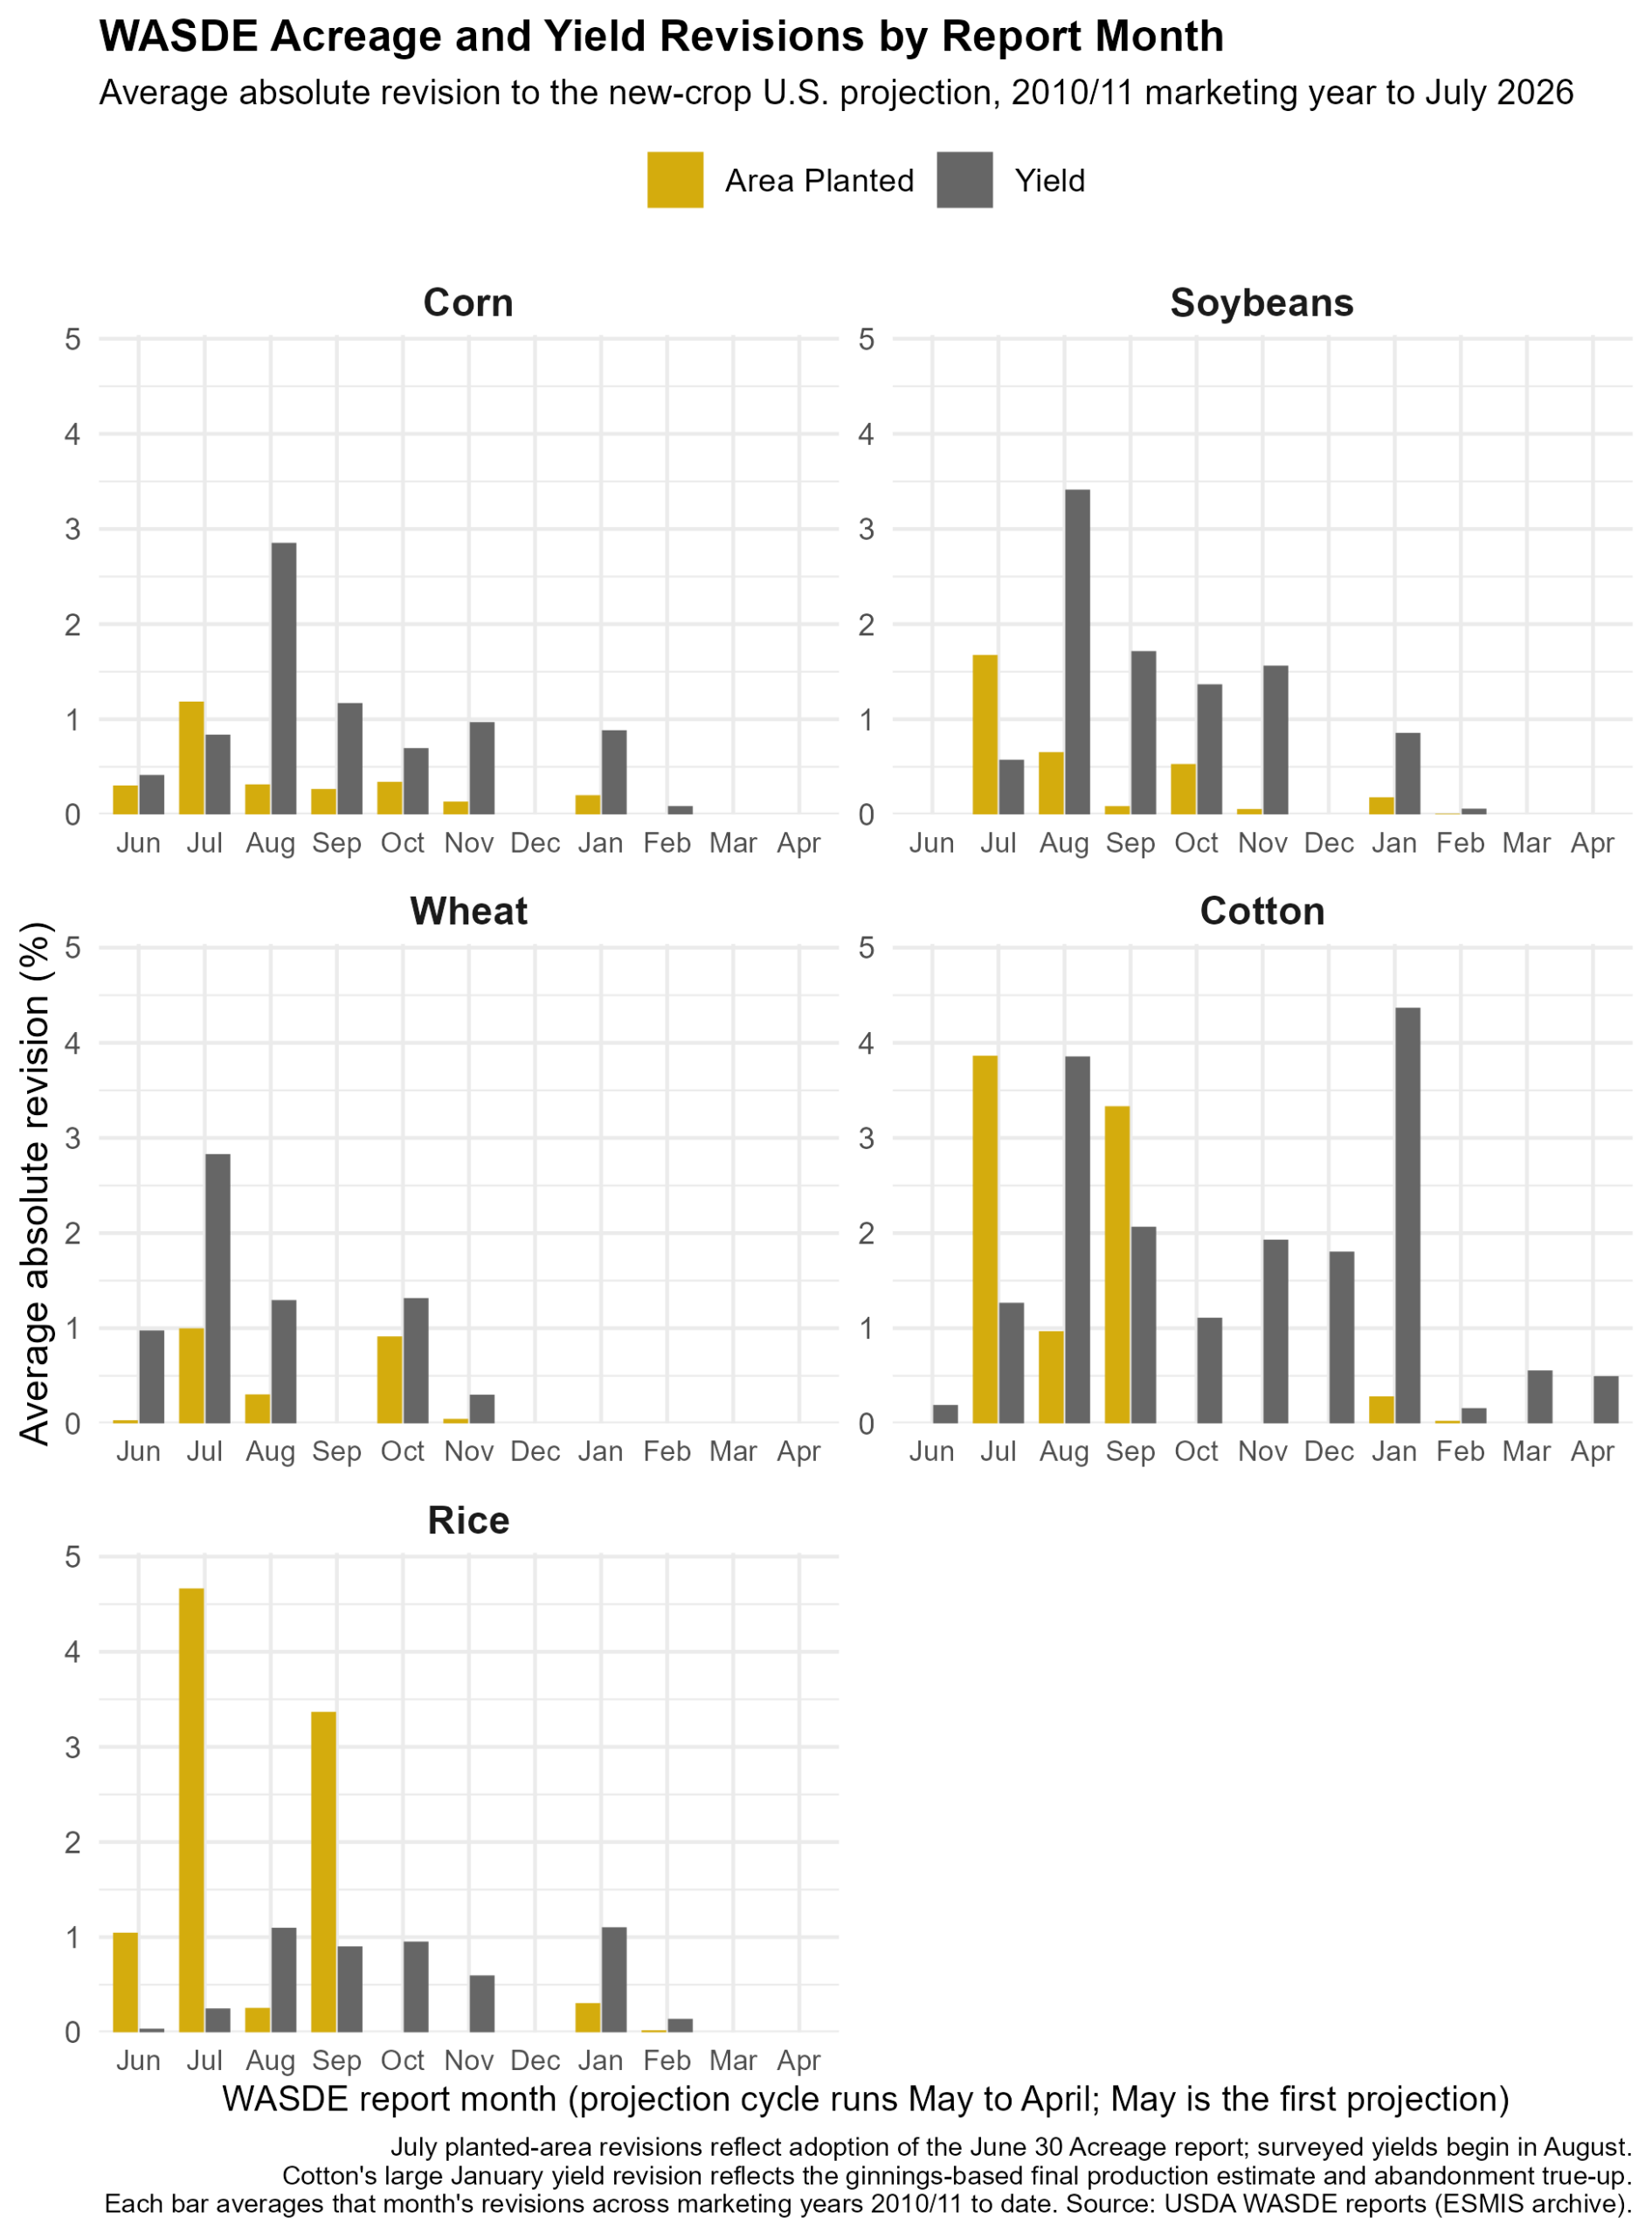
The July World Agricultural Supply and Demand Estimates (WASDE) report has a reputation as a quiet one for most crops. The reason is timing: USDA releases the Acreage report at the end of June (Rabinowitz, 2026), and the World Agricultural Outlook Board folds those acreage numbers into the July WASDE while leaving yield projections untouched until the August surveys begin. Wheat is the exception, receiving its largest yield revision of the year in July. Because the acreage numbers are already public, prices tend to move when the Acreage report is released, not when the WASDE repeats it two weeks later.
Figure 1 shows the average absolute revision to acreage and yield in each monthly WASDE from the 2010/11 marketing year through the most recent report. The pattern is clear: the largest acreage revisions cluster in July with small changes to yield estimates when the Acreage report enters the balance sheet, and the largest yield revisions arrive in August with the first survey-based estimates.
On the supply side, the July 2026 WASDE mostly followed the script. Acreage changed for soybeans (+0.8%), wheat (-2.5%), cotton (+2.2%), and rice (-12.9%), while corn acreage was left unchanged. Yield revisions were modest: wheat (+1.9%), cotton (+0.7%), and rice (+0.2%), with corn and soybean yields held at trend. Adding in beginning stocks and imports, total corn supply fell 120 million bushels (-0.7%), soybean supply rose 30 million bushels (+0.6%), wheat supply fell 22 million bushels (-0.8%), cotton supply rose 0.4 million bales (+2.3%), and rice supply fell 20.9 million cwt (-7.6%).
On the demand side, corn and soybean total use increased 50 million bushels (+0.3%) and 30 million bushels (+0.7%), both on stronger exports. Rice was the opposite: USDA cut total use 9 million cwt (-3.9%), mostly domestic, to absorb part of the smaller crop.
The net result shows up in ending stocks. Carryout fell 8.7% for corn (moderately bullish), 3.0% for wheat (mildly bullish), and 27.8% for rice (strongly bullish), while cotton carryout rose 10.8% (bearish) and soybean carryout was unchanged (neutral).
The quiet reputation of the July WASDE is really a statement about yields, not about the balance sheet. The report rarely delivers new information because the June 30 Acreage and Grain Stocks reports have already done the talking, but as this month shows, what they say can be substantial. Rice supplies tightened dramatically, corn carryout fell on stronger old-crop use, and cotton stocks built with no offsetting demand. For Southern producers, the July report is less a market event than a scorecard of how the June Acreage and Grain Stocks reports reshaped the year ahead. The real test arrives in August, when USDA replaces trend yields with its first survey-based estimates and the largest revisions of the season historically follow. With corn and soybean yields still penciled in at trend, August, not July, is the report with the most room to surprise.
Recommended citation format: Gardner, Grant. “July 2026 WASDE: Acreage Moves in July, Yields Move in August.” Southern Ag Today 6(29.3). July 15, 2026. Permalink