
Authors: Andrew Wright and Manuel Garcia
Many producers hire custom operators to perform production activities on their farms. The costs of these services vary by state, service, and provider, and are often not publicly advertised. For this reason, many state extension services survey producers and custom operators to estimate the cost of custom services in their states. In February of this year, Texas A&M AgriLife Extension published its most recent survey of custom rates in Texas. The results offer additional insight into how rising costs have affected farmers’ bottom lines in the state.
The survey was conducted from August through October 2025 and is based on responses from 391 individuals, including producers, custom operators, farm managers, and extension agents. While we cannot summarize all results here, we can highlight some general conclusions about row-crop operations.
Figure 1 summarizes the average percentage change in the reported custom rate for each category of operations included in the survey since 2020, the last time this survey was conducted. On average, the largest cost increases were observed in the tractor rental and application services categories. Custom rates for row crop operations (i.e., tilling, planting, harvesting, and application services) increased by 30 to 39 percent in Texas.
As we consider these results, we might ask two questions: 1) How do the observations from the Texas survey compare with the general rise in costs across the national economy, and 2) How do the Texas custom rates compare with those of other Southern states?
To help answer the first question, Figure 1 also includes two measures from the Producer Price Index (PPI), which tracks the average change in selling prices producers receive for their output. The first measure shown in the figure is the percentage change in the average annual PPI from 2020 to 2025 across all goods and services. The second shows the percentage change in the average annual PPI for farm machinery and equipment manufacturing over the same period. Both measures fall within the range of increases we’ve seen for custom rates for row-crop operations in Texas.
The second question is more difficult to answer. Many states conduct surveys of custom rates, like the Texas survey (see Table 1 for links to the most recent reports on custom rates in other southern states). Table 2 compares selected Texas custom rates from our most recent survey with those for similar activities in other states.
Overall, the custom rates reported for Texas are not dissimilar to those reported in other states. However, keep in mind these surveys are not conducted on the same schedule or using the same methods, so direct comparisons are limited.
Most of the custom rates we report here for Texas include the cost of machinery, fuel, and operator labor. Therefore, it is reasonable to assume that the increase in custom rates we observe can be explained in large part by increases in the retail price of farm machinery, higher interest rates (the cost of financing machinery purchases), and, more recently, higher fuel costs.
While it is no secret that farm operating expenses have risen recently, the conversation typically focuses on fertilizer, fuel, and chemical costs. The 2026 Texas Custom Rate Survey highlights a broader rise in operating expenses beyond these categories. That said, we think it is important to note that since 2020, the sticker price for new and used farm machinery has increased significantly as well. While custom rates have certainly increased, many producers may still find it more cost-effective to hire custom work than to finance machinery purchases and perform these operations themselves.
Figure 1. Average percentage increases in Texas custom rates, 2020-2026
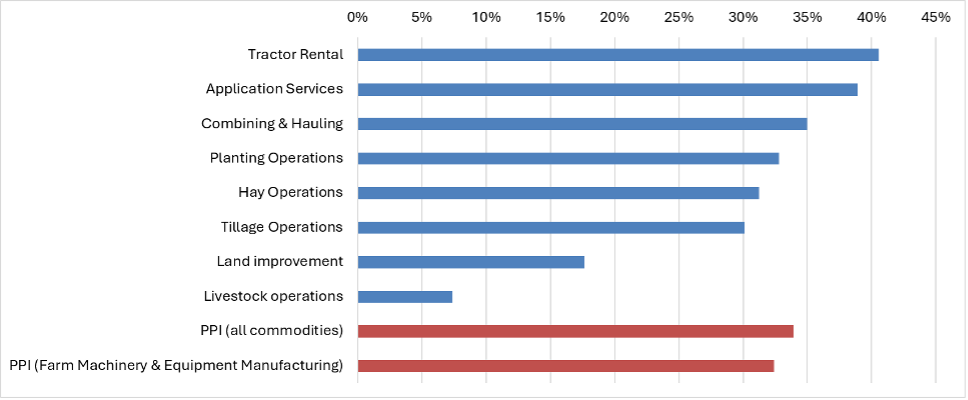
Table 1. Links to recent custom rate surveys conducted in southern states
Table 2. Comparison of custom rates across similar activities in southern states
| Average rate ($/acre) | ||||||
| Category | Custom work | Texas (2026) | Arkansas (2025) | Mississippi (2024) | Georgia (2024) | Kentucky (2024) |
| Land tillage | Disk/Disk-harrow | $ 24.2 | $ 15.3 | $ 16.8 | $ 21.7 | $ 20.0 |
| Field Cultivator | $ 19.0 | $ 10.5 | $ 16.5 | $ 15.9 | $ 19.0 | |
| Fertilizer application | Liquid fertilizer | $ 10.8 | $ 16.5 | $ 12.3 | $ 18.4 | $ 9.0 |
| Aerial fertilizer | $ 13.6 | $ 13.6 | $ 25.1 | |||
| Dry fertilizer | $ 13.4 | $ 4.6 | $ 9.0 | $ 13.0 | $ 7.5 | |
| Combine | Combine corn | $ 34.7 | $ 66.6 | $ 47.0 | $ 58.5 | $ 42.0 |
| Combine soybeans | $ 39.7 | $ 43.1 | $ 43.0 | $ 54.7 | $ 40.0 | |
| Combine wheat/small grains | $ 31.3 | $ 40.7 | $ 41.0 | $ 52.3 | $ 38.5 | |
| Note: Arkansas rates are based on: Disk harrow (28′), Field cultivator (24′), Liquid fert appl (8R-30), and combines for corn (6R-30), soybean (25′ flex), and wheat/sorghum (22′ rigid). | ||||||
References
U.S. Bureau of Labor Statistics, Producer Price Index by Commodity: All Commodities [PPIACO], retrieved from FRED, Federal Reserve Bank of St. Louis; https://fred.stlouisfed.org/series/PPIACO, June 20, 2026.
U.S. Bureau of Labor Statistics, Producer Price Index by Industry: Farm Machinery and Equipment Manufacturing [PCU333111333111], retrieved from FRED, Federal Reserve Bank of St. Louis; https://fred.stlouisfed.org/series/PCU333111333111, June 25, 2026.
Recommended citation format: Wright, Andrew, and Manuel Garcia. “Rising Custom Rates Add to Producer Cost Pressures.” Southern Ag Today 6(31.1). July 27, 2026. Permalink