Authors: William E. Maples and Adam Rabinowitz
When choosing where and when to deliver grain, producers often first focus on the posted price. However, the highest posted price may not always result in the highest net return. Grain moisture, buyer discounts, delivery distance, fuel costs, labor, and wait times can all affect the final value of a load. Here we discuss the impact of delivery decisions on the final price of grains.
Grain Moisture
Most corn and soybean buyers use a standard moisture level when purchasing grain. Corn is commonly priced at 15 percent moisture, while soybeans are typically priced at 13 percent moisture. Grain delivered above the standard moisture level is generally subject to a discount because wetter grain contains more water and less marketable dry matter. However, delivering grain below the standard moisture level can also reduce producer returns because the additional dry matter is typically sold without receiving a premium or an adjustment in the number of bushels delivered.
Figure 1 illustrates the effect of corn moisture on revenue using an assumed moisture discount schedule and a base price of $4.50 per bushel. At 16 percent moisture, the producer would receive a moisture discount of approximately 9 cents per bushel, reducing the effective price to $4.41 per bushel. As moisture increases, the discount becomes larger. At 18 percent moisture, the estimated discount increases to approximately 29 cents per bushel, reducing the effective price to $4.21 per bushel.
Moisture levels below 15 percent also affect revenue, although the loss does not appear as a direct discount for the producer. In this example, delivering corn at 14 percent moisture instead of 15 percent results in a loss of approximately 5 cents per bushel. The lower-moisture corn contains more dry matter per delivered bushel, but the producer is still paid based on the same standard bushel weight. Therefore, the additional dry matter is delivered without additional compensation.
Distance and Wait Times
Delivery distance and elevator wait time can also affect which grain buyer provides the highest net return. Table 1 compares several delivery scenarios that differ by distance and unloading time. As expected, total delivery cost increases as distance increases. In this example, Buyer 1 is located 10 miles away, while Buyer 4 is 25 miles away. Delivering to Buyer 4 costs approximately 10 cents more per bushel than delivering to Buyer 1.
Although Buyer 1 has a longer wait time of 30 minutes compared with 10 minutes for Buyer 4, the added waiting cost is smaller than the transportation cost associated with the additional distance. This suggests that distance is the primary driver of delivery cost in the example. However, wait time still matters, especially during harvest when delays can reduce the number of loads moved in a day and can increase the potential for weather related losses. Producers should consider total delivery time, including both travel and unloading, rather than focusing on either factor alone.
Alternative Delivery Times
An alternative to delivery at harvest involves the storage of grain, but this isn’t always the best answer either. Previous Southern Ag Today articles have discussed both the flexibility that storage can provide, as well as the additional costs for extra drying, shrinkage, quality deterioration, and additional handling (Duncan and Smith 2022; Maples 2022). However, on-farm storage is generally limited in the southern region (Pittman and Rabinowitz 2025). Producers can then consider delayed pricing contracts, commercial storage, and re-ownership positions (Smith 2022). Thus, several options can exist to delay delivery for an expected better price, but these also must be carefully evaluated.
The combination of moisture, delivery costs, and delivery timing can make a difference for producers when comparing prices of delivered grains. The bottom line is to look past the posted price and make sure to consider the other options and associated costs when deciding where and when to market the grain.
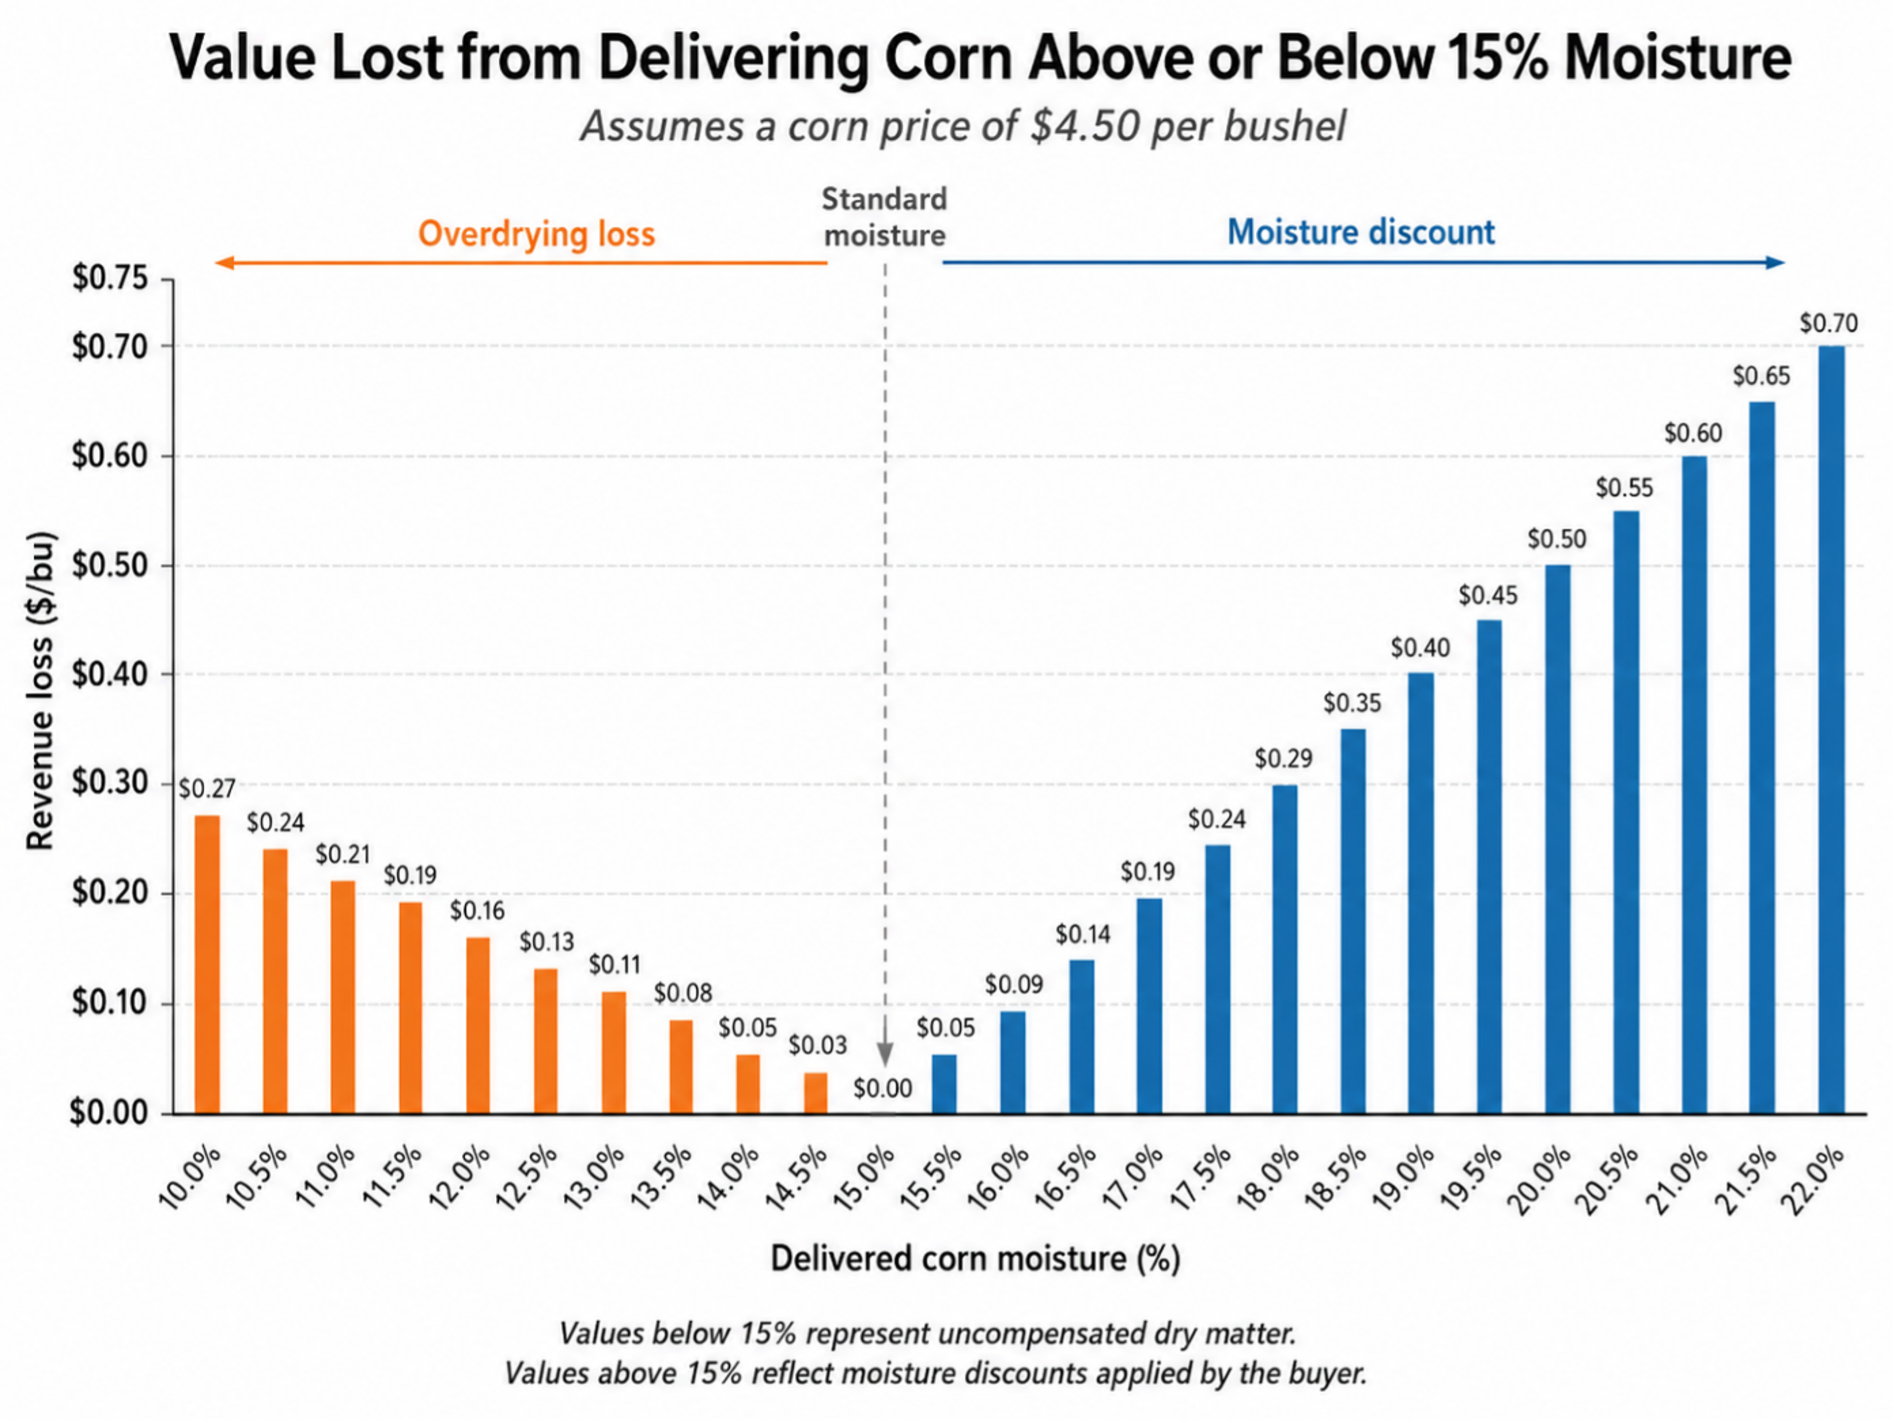
Table 1. Estimated transportation costs and net price across four grain buyers
| Buyer | One-way distance (miles) | Wait & unload time (minutes) | Fuel cost (¢/bu) | Truck overhead (¢/bu) | Labor cost (¢/bu) | Total delivery cost (¢/bu) | Posted price ($/bu) | Price less delivery cost (4/bu) |
| Buyer 1 | 10 | 30 | 1.40 | 4.80 | 1.24 | 7.45 | $4.50 | $4.43 |
| Buyer 2 | 15 | 10 | 2.11 | 7.20 | 1.10 | 10.40 | $4.50 | $4.40 |
| Buyer 3 | 20 | 5 | 2.81 | 9.60 | 1.28 | 13.69 | $4.50 | $4.36 |
| Buyer 4 | 25 | 10 | 3.51 | 12.00 | 1.68 | 17.19 | $4.50 | $4.33 |
References:
Duncan, Hence, and S. Aaron Smith. “Estimating the Cost of a Grain Bagging System“. Southern Ag Today 2(31.3). July 27, 2022.
https://southernagtoday.org/2022/07/estimating-the-cost-of-a-grain-bagging-system/
Maples, William E. “On-Farm Grain Storage in Southern States“. Southern Ag Today 2(38.1). September 12, 2022. https://southernagtoday.org/2022/09/on-farm-grain-storage-in-southern-states/
Pittman, Wilton, and Adam Rabinowitz. “Marketing Challenges from Storage Capacity and Excess Supply.” Southern Ag Today 5(36.3). September 3, 2025. https://southernagtoday.org/2025/09/03/marketing-challenges-from-storage-capacity-and-excess-supply/
Smith, S. Aaron. “Marketing Strategies if Producers Do Not Have Access to On-Farm Storage.” Southern Ag Today 2(40.1). September 26, 2022. https://southernagtoday.org/2022/09/26/marketing-strategies-if-producers-do-not-have-access-to-on-farm-storage/
Recommended citation format: Maples, William E., and Adam Rabinowitz. “Considerations When Making Grain Delivery Decisions.” Southern Ag Today 6(31.3). July 29, 2026. Permalink
