As AI expands, rural areas are increasingly targeted for new data centers. According to the Pew Research Center, while 87% of existing AI data centers are in urban areas, 67% of newly planned facilities are sited in rural counties (Seets & Radde, 2026). Local opinions about rural data centers are mixed. Some residents view them as a last chance for sustained economic growth, while others argue that they require substantial amounts of water and energy while providing limited local benefits (Nickelsburg, 2025). Although construction of a large facility produces a massive one time economic boost, questions remain about the longer term operational impacts on rural counties. How much do data centers actually help rural communities?
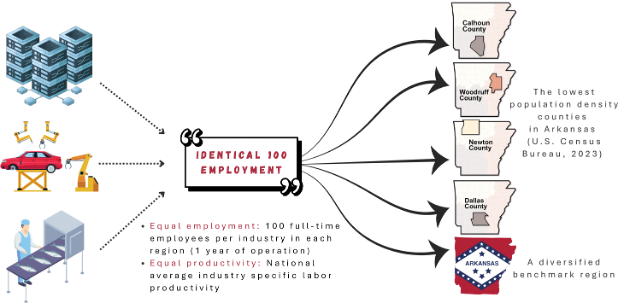
To explore this question, this article examines a “what-if” scenario in which rural counties add 100 jobs with the same national average productivity and work hours across three sectors: data centers, automobile manufacturing, and food manufacturing, with the latter two representing traditional rural manufacturing industries (Figure 1). Would a data center generate more economic value than food manufacturing or automobile manufacturing? To answer this question, an IMPLAN input-output (IO) model was used to develop scenarios. In plain terms, this model tracks how economic activity flows through a local economy, capturing not just the direct jobs in an industry, but also the ripple effects generated through purchases of intermediate inputs and services from suppliers (indirect effects), and household spending of employees in the sectors (induced effects) (IMPLAN, 2024). The analysis focuses on single year operational impacts only, rather than construction phase or long term project effects. While large scale facilities typically generate substantial one time construction impacts, capturing multi year outcomes would require a dynamic modeling framework, which is beyond the scope of this study. Accordingly, the analysis focuses on the direct, indirect, and induced impacts associated with annual facility operations.
This scenario covers five regions: the state of Arkansas, a diversified benchmark region, and the four most rural counties in the state: Calhoun County in the south, Newton County in the north, Woodruff County in the east, and Dallas County in the south central region. These counties were selected based on U.S. Census Bureau data (U.S. Census Bureau, 2023) to represent the lowest population density counties across geographically distinct areas of Arkansas. In addition, each scenario is standardized to 100 direct jobs, defined as full-time equivalent (FTE) positions (Clouse, 2024), with total output determined based on national average output per job. This approach ensures comparability across sectors and regions and enables a direct comparison of sectoral impacts. While a standard data center typically requires significantly less daily operational labor than traditional manufacturing, this standardized baseline effectively isolates and compares how each industry’s structural linkages perform within rural economies.
Figure 1. Conceptual Framework
At the state level, data centers perform quite strongly (Table 1). Their output multiplier (1.64) is nearly identical to that of food manufacturing (1.65) and higher than that of automobile manufacturing (1.52), suggesting that data centers generate a comparable level of total economic activity per dollar of output. Interestingly, the state model shows data centers scoring a slightly higher employment multiplier than food manufacturing. This happens because, on a statewide scale, the massive corporate operations and tech support networks required to run these facilities are large enough to trigger significant job creation activities and impacts across the broader Arkansas economy.
Table 1. Economic Multipliers for Data Centers and Selected Manufacturing Industries by Region
| Region | Sector | Output Multiplier (Total economic activity per $1 of direct output) | Employment Multiplier (Total jobs supported per 1 direct job) | Tax impact per Output ($ tax revenue per $1 of output) |
| Arkansas State | Data Center | 1.64 | 2.54 | 0.11 |
| Food Manufacturing | 1.65 | 2.49 | 0.07 | |
| Auto Manufacturing | 1.52 | 5.22 | 0.05 | |
| Calhoun County | Data Center | 1.13 | 1.27 | 0.10 |
| Food Manufacturing | 1.19 | 1.78 | 0.05 | |
| Auto Manufacturing | 1.06 | 1.52 | 0.03 | |
| Dallas County | Data Center | 1.20 | 1.51 | 0.11 |
| Food Manufacturing | 1.22 | 1.77 | 0.05 | |
| Auto Manufacturing | 1.07 | 1.83 | 0.03 | |
| Newton County | Data Center | 1.23 | 1.94 | 0.13 |
| Food Manufacturing | 1.19 | 2.21 | 0.06 | |
| Auto Manufacturing | 1.06 | 1.97 | 0.03 | |
| Woodruff County | Data Center | 1.22 | 1.66 | 0.11 |
| Food Manufacturing | 1.26 | 1.62 | 0.06 | |
| Auto Manufacturing | 1.27 | 3.24 | 0.05 |
Note 2: To benchmark data center operations, three sectors, Data processing, hosting, and related services (Sector 418), All other food manufacturing (Sector 98), and Automobile and light duty motor vehicle manufacturing (Sector 324), are modeled in IMPLAN
Note 3: Standardizing to 100 jobs isolates differences in economic structure and local linkages across industries. Because industries differ in output per worker, the results reflect structural relationships rather than equal total investment levels.
Note 4: Employment multipliers reflect the magnitude of indirect (supply-chain) and induced (household-spending) effects captured within each region. Differences across regions and sectors arise from variation in local supply-chain linkages, leakage, and the labor intensity of industries receiving spillover effects, rather than output multipliers alone.
In rural counties, however, the pattern becomes more constrained. Output multipliers generally decline as economic activity leaks to surrounding regions, but data centers still produce output levels broadly comparable to manufacturing sectors. The key difference emerges in employment. Data centers generally produce fewer employment spillovers than manufacturing industries. This gap highlights a more limited ability to support broader local employment, suggesting weaker and less consistent integration into rural economic systems. Why does this happen? It really comes down to how rural economies are structured. Rural counties typically have smaller labor pools and fewer local suppliers. Data centers often rely on technically specialized workers, hardware, and external services, so some of the spending flows out to other regions. Conversely, manufacturing industries are more likely to hire locally and purchase inputs from nearby businesses, which helps keep dollars circulating within the community.
That said, there is one area where data centers consistently stand out: tax impact. Across all regions, data centers generate more tax impact per dollar of output than the other sectors. So even if not all the economic activity stays local, there can still be meaningful benefits for public finances. However, this result must be viewed with caution. In the real world, data center developers frequently condition their investments on massive local tax abatements or utility waivers (Goldman, 2026; Quinn, 2026; Plautz & Tomich, 2026). Therefore, the actual revenue flowing to a rural county’s public purse may be significantly lower than the theoretical baseline modeled here.
In addition, data centers can place significant demands on energy and water infrastructure, creating capacity challenges for smaller rural systems, particularly in resource dependent agricultural areas. These infrastructure constraints can limit the net local benefits of data centers and may require additional public or utility investment to support long-term operations.
The bottom line is not that data centers are “better” or “worse,” but that their impact depends heavily on local conditions. For rural communities considering data center investments, the key question is not just how large the investment is, but how much of that activity actually stays and circulates locally. Overall, the simulation suggests that data centers can generate output comparable to traditional industries in more diversified economies, but their local economic integration in rural areas is more limited.
References
Clouse, C. (2024, November 8). Employment in IMPLAN. IMPLAN Support.
https://support.implan.com/hc/en-us/articles/30779951167771-Employment-in-IMPLAN
Goldman, S. (2026, March 26). Meta AI data center Hyperion in Louisiana. Fortune.
https://fortune.com/2026/03/26/meta-ai-data-center-hyperion-louisiana
IMPLAN. (2025, August 12). What is IMPLAN? IMPLAN Blog.
https://blog.implan.com/what-is-implan
Nickelsburg, M. (2025, August 17). AI is driving a data center boom in rural America. Locals
are divided on the benefits. NPR.
https://www.npr.org/2025/08/17/nx-s1-5461467/ai-is-driving-a-data-center-boom-in-rural-america-locals-are-divided-on-the-benefits
Plautz, J., & Tomich, J. (2026, May 2). Data centers used to be a prize. States are having second
thoughts. Politico. https://www.politico.com/news/2026/05/02/data-centers-states-tax-incentives-00891184
Quinn, S. (2026, May 22). Google data center plan raises tax transparency questions in rural
Missouri. Missouri Independent.
https://missouriindependent.com/2026/05/22/google-data-center-plan-raises-tax-transparency-questions-in-rural-missouri/
Seets, S., & Radde, K. (2026, April 13). Most new data centers in the U.S. are coming to rural
areas. Pew Research Center.
https://www.pewresearch.org/short-reads/2026/04/13/most-new-data-centers-in-the-us-are-coming-to-rural-areas/
U.S. Census Bureau. (2023, September). County-level urban and rural information for the 2020
Census. https://www.census.gov/programs-surveys/geography/guidance/geo-areas/urban-rural.html
Recommended citation format: Seo, Frank. “Data Centers vs. Factories: Do AI Facilities Truly Benefit Rural Economies? Evidence from an Arkansas Simulation.” Southern Ag Today 6(32.5). August 7, 2026. Permalink