Producers that grew winter wheat in 2026 were most likely glad to put the season behind them. Winter wheat acres planted in the U.S. were the lowest since 2020. With only 67 percent harvested (tied with 2023 as the lowest on record), wheat acres harvested were the lowest since the USDA began reporting in 1909. The winter wheat yield of 47.0 bushels per acre was the lowest since 2015 (42.5 bushels). That resulted in a 990 million bushel winter wheat crop, the smallest since 1963.
However, wheat prices surged late in the growing season with Ukraine and Russia escalating attacks on shipping and port facilities in the Black Sea region. Even with a war extending past four years, that region still accounts for about 30% of global wheat exports.
Alternatively, the war with Iran has negative repercussions for producers planning for 2027. The restriction of shipping through the Strait of Hormuz has resulted in much higher fertilizer and fuel prices, and overall inflation continues to pressure all prices higher, squeezing profit margins even more.
Given the geopolitical situation and commodity and input price environment, let’s take an early season look at production, price, and profits for winter wheat.
Production. It is likely that U.S. winter wheat acres will increase in 2027. While wheat is not a major crop in every state in the South, the region as a whole accounts for about 20% of U.S. winter wheat production. Though the overall trend in wheat acres in the U.S. is on the decline, we tend to see an increase in acres when we see an increase in the season average farm price the year before. Moving from a $5.06 per bushel wheat price in 2025 to $6.20 in 2026 signals an increase in acres for 2027.
The National Oceanic and Atmospheric Administration is also predicting more than a 90% chance that the region will face a very strong El Nino weather pattern this fall and winter. That means an increased likelihood of a wetter and colder winter across the South. Since 2000, every state has seen above average precipitation in El Nino winters (December/January/February) (Iowa Environmental Mesonet, 2026). The forecast temperature track of the current El Nino is the strongest since the winter of 2015/16 (Figure 1). The 2016 winter wheat yield is the highest on record.
El Nino years also tend to produce a higher percentage of planted wheat harvested: 81% versus a 78% average since 2000. With an increase in acres and increased precipitation, winter wheat production prospects in 2027 look much improved from 2026.
Price. As of September 4, 2026, the price for July 2027 winter wheat contracts is $7.53 per bushel for Chicago soft red winter wheat and $8.11 for Kansas City hard red winter wheat. That is up from the July 2026 contract closing prices of $6.31 for Chicago wheat and $6.64 for Kansas City wheat. The current futures prices for both Chicago wheat and Kansas City wheat are trading in the top third of their nearby price ranges going back over the last 10 years (Figure 2).
Profit. USDA’s Risk Management Agency sets the crop insurance base price for winter wheat using the average closing price of the Chicago and Kansas City July contracts from August 15 through September 14. This is important because higher base prices mean the revenue guarantee from crop insurance will provide a higher safety net for wheat in 2027.
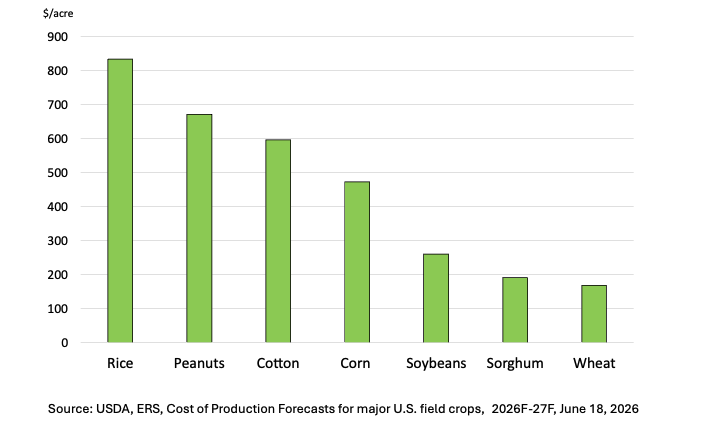
Costs, however, are going to be higher too. But costs for wheat compared to other crops are generally considerably less, as shown by USDA’s most recent forecast of costs of production for 2027 (Figure 3). If the El Nino winter results in higher-than-average wheat yields, that will help lower next year’s breakeven price for wheat.
Planting winter wheat can also provide cover crop benefits that promote soil health and benefit overall farm productivity, whether the crop is kept for harvest or not. And with wheat, the decision can be made in late winter whether to take to grain, harvest as forage or pasture, or terminate and plant another crop when we have more clarity around comparative profitability of all the farm’s enterprise possibilities.
Figure 1. Sea Surface Temperature Deviations, El Nino Winters since 2000
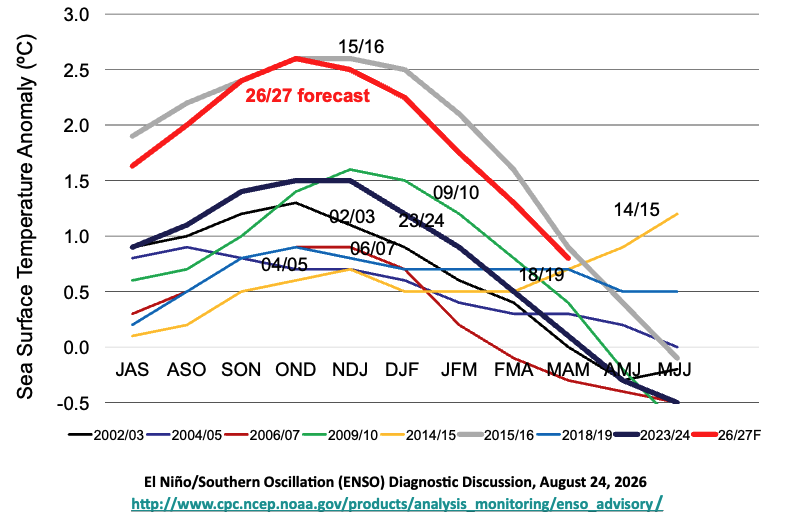
Figure 2. Nearby Chicago Soft Red Winter Wheat Futures (Tuesday prices)
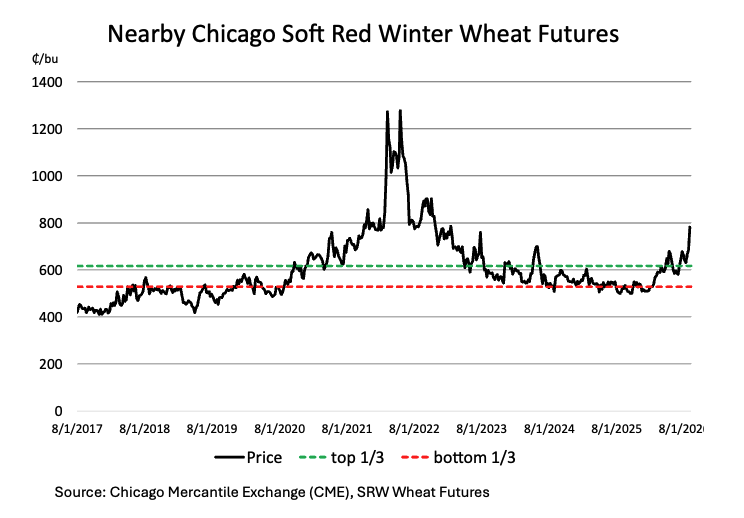
Figure 3. 2027 Cost of Production Forecast–Total Operating Costs
References
Chicago Mercantile Exchange (CME). SRW Wheat Futures
USDA, NASS. Quick Stats. Accessed online August 25, 2026, USDA – National Agricultural Statistics Service – Quick Stats.
USDA, RMA. Price Discovery-Home. Accessed online August 11, 2026, RMA Price Discovery – Home.
USDA, ERS. Commodity Costs and Returns. Accessed online August 11, 2026, Commodity Costs and Returns | Economic Research Service.
Iowa Environmental Mesonet, Iowa State University. Monthly/Yearly Precip/Temperature Statistics by Year. Accessed August 10, 2026, 108. Accumulated Station Departures of Precip/GDD/SDD (Long Term Climate).
NOAA, Climate Prediction Center. El Niño/Southern Oscillation (ENSO) Diagnostic Discussion, August 24, 2026, http://www.cpc.ncep.noaa.gov/products/analysis_monitoring/enso_advisory/
Recommended citation format: Welch, Mark. “Production, Price, and Profit Prospects for the 2027 Wheat Crop.” Southern Ag Today 6(37.3). September 9, 2026. Permalink