The market outlook for cotton is similar to other commodities in that it is influenced by expectations of supply and demand. Cotton’s “new crop” outlook specifically refers to the 2027/28 marketing year, when the 2027 crop will be produced, processed, stored, and sold. A major supply-related question is how much 2027 acreage will be planted to cotton. The price of competing crops, relative to cotton prices, is an important consideration to the level of planted cotton acreage. Figure 1 shows a fairly strong relationship between the level of U.S. upland and pima cotton planted (as measured on June 30) and the ratio of December CBOT corn futures and ICE cotton futures during the first quarter of the year. The higher the ratio, the less cotton is planted.
Of course, there are other important competing crops as well, e.g., sorghum, soybeans, and peanuts. There are various other influences, including how dry it is in Texas, the insurance base price, fixed cost influences, and the psychological influence of the preceding growing season. But the price ratio of corn to cotton appears to capture a lot of these other influences in explaining variations in cotton plantings.
What does Figure 1 imply for 2027? As of September 21, the Dec’27 CBOT corn/Dec’27 ICE cotton price ratio was 6.77 (i.e., $5.37 corn divided by 79-cent cotton). Assuming this ratio prevails during Q1 of 2027, it is historically associated with between 10.0 and 11.0 million acres of all cotton. A simple univariate regression, based on the data underlying Figure 1 and the prices as of September 21, projects a point estimate of 10.3 million acres planted.
Under what conditions will the 2027 crop be planted? The National Oceanic and Atmospheric Administration’s Climate Prediction Center forecasts a 90% chance of strengthening El Niño conditions during the fall and winter. The latter is associated with wetter weather patterns in some of the drier portions of the Cotton Belt. This increases the possibility of harvesting more planted acreage, particularly dryland acreage in the southern plains region. This has implications for the 2027 production and supply.
Assuming 10.3 million planted acres of all cotton in 2027, and further assuming modestly below average abandonment (14%) and yield per harvested acre (800 lbs), the result is a healthy crop of 14.76 million bales (Table 1). This combines with NASS’s September 11, 2026, projection of 3.60 million bales of carry-in for an 18.37 million bale supply. Matching this supply against a possible 14.5 million bales of total use, which assumes a modest increase in exports simply from having more exportable surpluses, results in 3.87 million bales of ending stocks of U.S. cotton in 2027/28. That outcome is neutral for prices as it represents static year-over-year ending stocks.
Caveats. Obviously, the analysis above depends on price ratios which may change between now and early 2027. Furthermore, the price ratio approach to forecasting planted acreage will be replaced by grower survey results, beginning at the Beltwide Conference (January 6) and continuing with the National Cotton Council’s survey release (February 8) and the United States Department of Agriculture’s Prospective Plantings report (March 31) and Acreage report (June 30).
The other major caveat is the outcome for abandonment. The 2007 and 2010 crops are examples of unexpectedly low abandonment (e.g., 5%) following El Niño winters. This poses a risk of greater supply and perhaps weaker prices.
Figure 1. Ratio of Dec Corn:Dec Cotton Futures, 1st Quarter average, vs, June30 Reported Acreage of All Cotton with Linear Trend Line
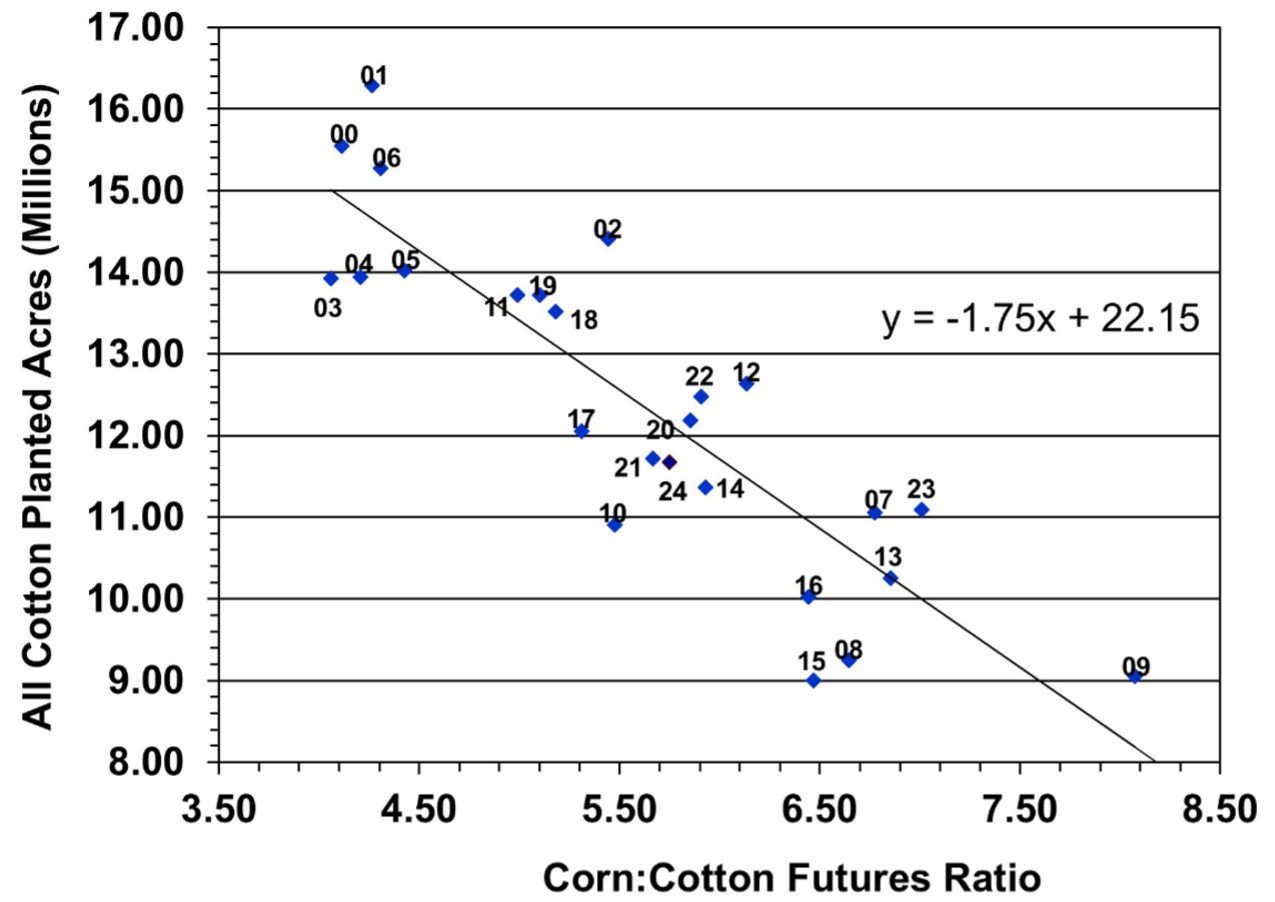
Table 1. U.S. All Cotton Balance Sheets for 2025/26, 2026/27, and 2027/28 Marketing Years.
| 2025/26 | 2026/27 | 2027/28 | |
| Area Million Acres | |||
| Planted | 9.28 | 10.45 | 10.30 |
| Harvested | 7.83 | 8.16 | 8.86 |
| Pounds | |||
| Yield/Harvested Acre | 852 | 776 | 800 |
| Million 480 Pound Bales | |||
| Beginning Stocks | 4.00 | 4.15 | 3.60 |
| Production | 13.90 | 13.20 | 14.76 |
| Imports | 0.00 | 0.01 | 0.01 |
| Supply, Total | 17.90 | 17.36 | 18.37 |
| Domestic Use | 1.50 | 1.50 | 1.50 |
| Exports, Total | 12.30 | 12.30 | 13.00 |
| Use, Total | 13.80 | 13.80 | 14.50 |
| Unaccounted | -0.05 | -0.04 | 0.00 |
| Ending Stocks | 4.15 | 3.60 | 3.87 |
| Stocks-to-Use | 29.4% | 26.1% | 26.7% |
Author’s Forecast of 2027/28.
Recommended citation format: Robinson, John. “The Market Outlook for New Crop Cotton.” Southern Ag Today 6(40.3). September 30, 2026. Permalink