Authors: Julio Bellodi Cortarelli and Grant Gardner
Every year, producers face the same question: when should I price the new crop? Price too early and a summer weather rally can leave you watching prices climb with regret. Wait, and the rally may never come. So, when during the year do good pre-harvest pricing opportunities tend to show up?
In this article, we analyze daily settlement prices (CME Group) for December corn futures across 35 contract years (1990-2024) and November soybean futures across 32 (1993-2024), tracking each contract through the final year of its life, from the day the prior year’s contract expired (the roll) to the day it expired itself. The soybean series starts later because 1993 is the first year in our data with a complete contract of daily prices. We define a good marketing day as any day the price closed in the top quarter of that contract year’s prices. The hit rate is the percentage of each month’s trading days that were good marketing days, adjusted for the differing number of trading days in a month. If good days were spread evenly across the year, every month would sit near 25%.
On average, corn shows a clear pattern (Figure 1). Every month from the December roll through June averages a hit rate at or above 28%, and then the rate falls away: 21% in July, 13% in August, and 12% in September. Soybeans are flatter: every month averages between 20% and 31%, and no month stands out. In both crops, however, the vertical lines matter more than the bars. Every month’s range reaches zero, so even the best months deliver almost nothing in some years, and most months have also topped 80% of their days in their best years. Corn’s late summer is the exception on the upside: even its strongest years rarely pushed August above 40%.
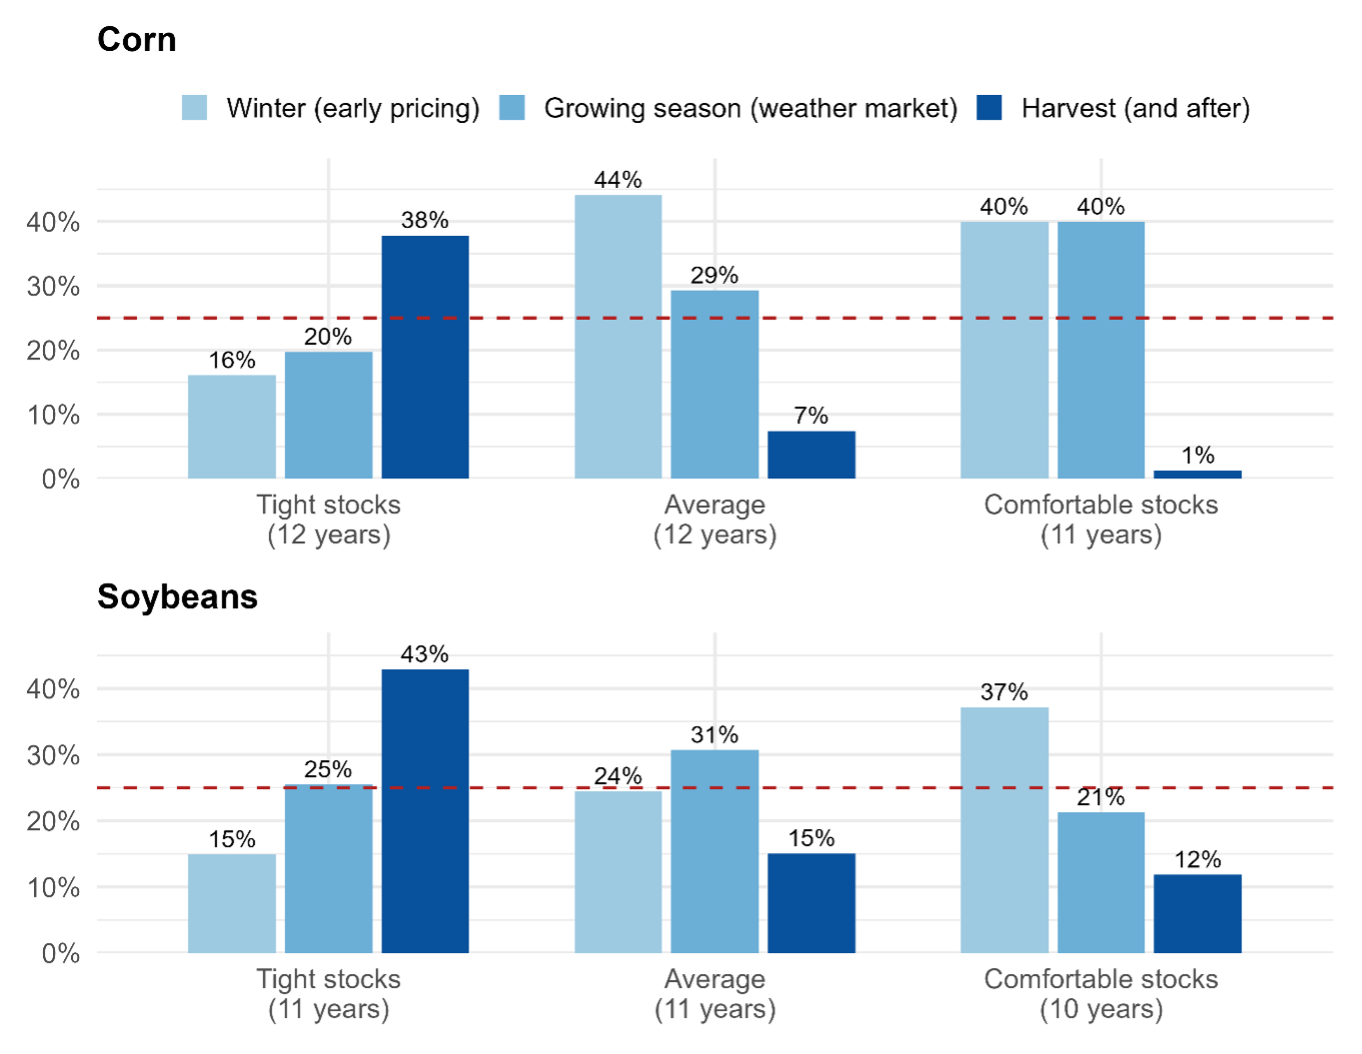
Figure 1 may not line up with intuition. Most producers can remember a year when the best prices showed up in a summer weather rally, and seasonal price averages back that memory up (Maples and Gardner, 2023). Rally years happen, but most years are not rally years, and the average reflects that. What separates one kind of year from another is the balance sheet. When we cut the data into three groups by the marketing year’s final stocks-to-use ratio (ending stocks divided by total use, USDA Economic Research Service), the good marketing days land in a different part of the year for each group (Figure 2).
In tight-stocks years, both crops behave the same way: the good days come at harvest and after. Corn’s harvest window runs a 38% hit rate and soybeans 43%, well above the 25% benchmark, while the winter months in both crops fall well below it.
In average years, the crops part ways. Corn’s opportunities shift to the winter window while its harvest hit rate collapses to 7%. Soybeans instead concentrate in the growing season, the classic weather-market year.
In comfortable years, the good days come earliest. Corn’s good days sit in winter, with a second window during the growing season, and soybeans move almost entirely to winter. Harvest offers little in either crop: a 1% hit rate in corn and 12% in soybeans.
For corn, the lesson is a threshold: waiting for harvest paid off only when stocks were tight. For soybeans, it is a slide: as supplies build, the good days move from harvest to the growing season to winter. In these years, tight meant ending stocks near 9% of annual use for corn and 6% for soybeans; comfortable meant roughly double that. Producers never see the final number in advance, but USDA publishes a running projection each month in the World Agricultural Supply and Demand Estimates (WASDE) report; the September WASDE puts 2026/27 near 10% for corn and 7% for soybeans.
These patterns matter now because the balance sheet is tightening. After running above its recent norm from 2023 through 2025, stocks-to-use projections for 2026/27 are just below normal for both crops, which puts the year in our average group. In average years the opportunities have come early: corn’s good days concentrated in the winter window and soybeans’ in the growing season. For the 2027 crop, that pattern points to the months just ahead: December through March for corn and the spring and summer months for soybeans, so long as the balance sheet stays near its current range. If supplies tighten further, history says the harvest window comes back into play.
Still, no single month can be counted on. The range lines in Figure 1 show the same month delivering almost no good days in one year and nearly all of them in another. Stocks shift the odds, but they do not remove the risk. These windows tell producers when to pay attention; production costs, expected yield, and insurance coverage tell them when to act.
Figure 1. Average good marketing day hit rate by contract month, December corn and November soybean futures. Bars show the percentage of each month’s own trading days that closed at or above the contract year’s 75th percentile price, averaged across contract years. The dashed line marks the 25% benchmark expected if the calendar did not matter; vertical lines show the 10th–90th percentile range across years. Months marked * and + are the partial months just after the roll and just before expiration, about 10 trading days each. Source: CME December Corn and November Soybean Futures.
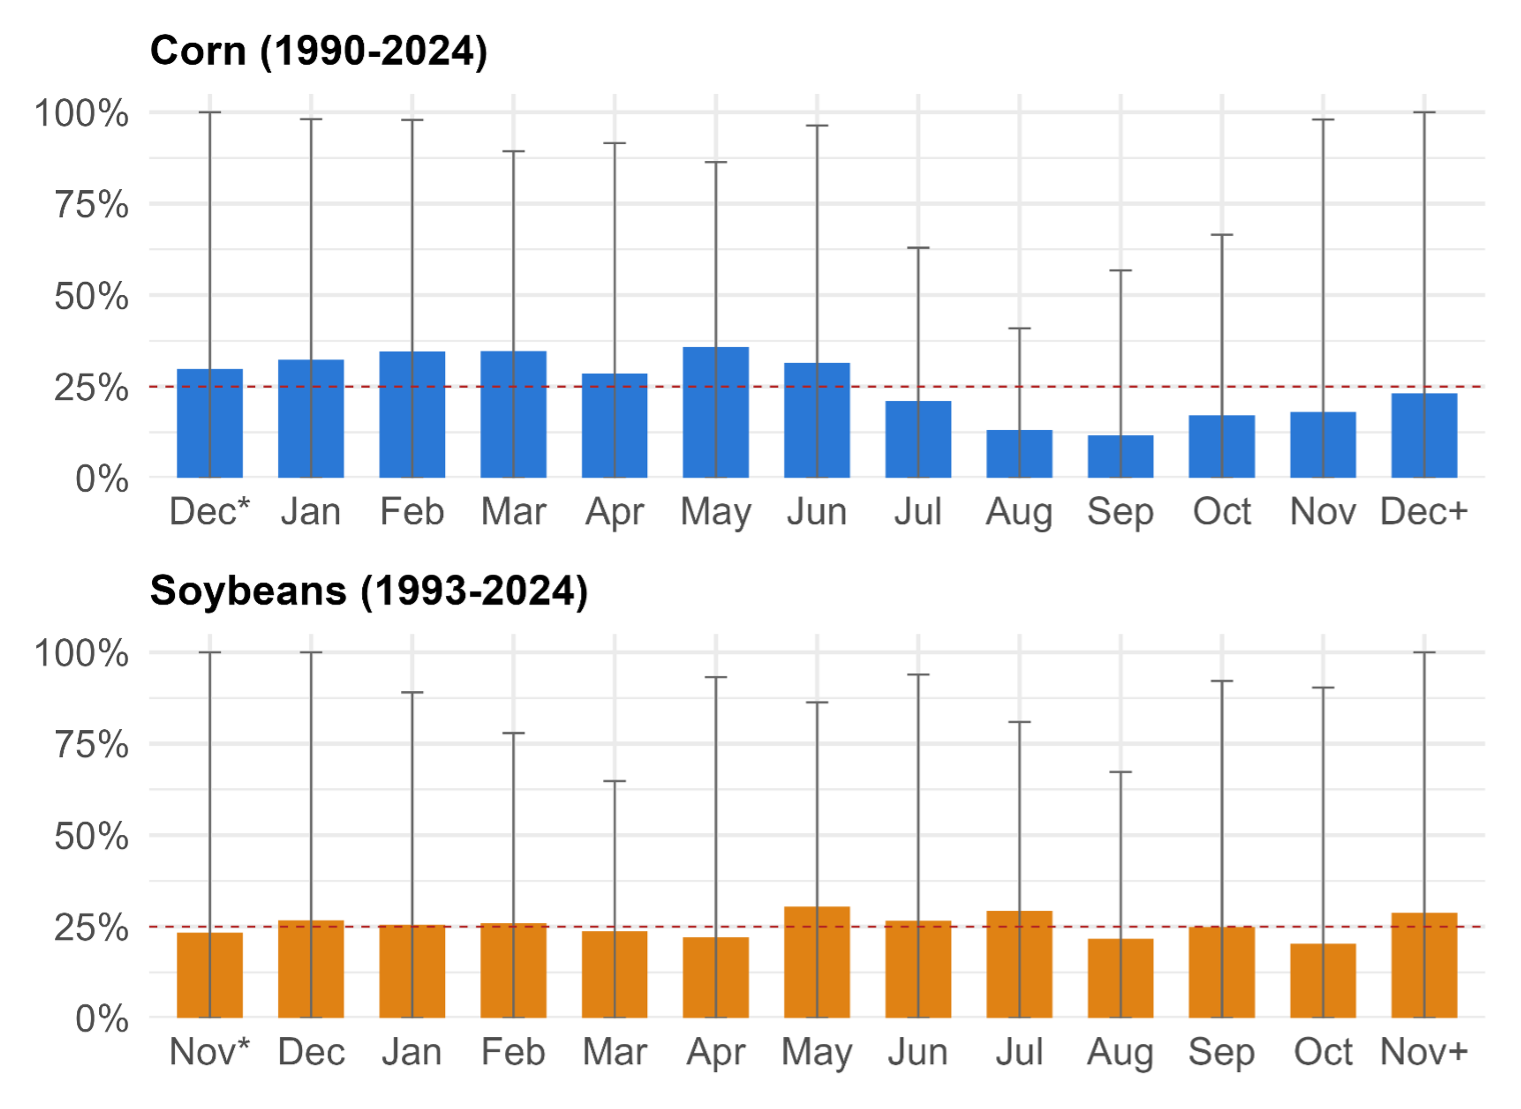
Figure 2. Average good marketing day hit rate by marketing window and stocks-to-use category. Contract years are sorted into thirds by ending stocks-to-use relative to its own 11-year median. Windows for corn: winter (Dec–Mar), growing season (Apr–Jul), harvest (Aug–Dec); for soybeans: winter (Nov–Mar), growing season (Apr–Aug), harvest (Sep–Nov). The dashed line marks the 25% benchmark. Source: CME futures; USDA ERS Feed Grains and Oil Crops Yearbooks.
REFERENCES
CME Group. December Corn Futures (1990–2024) and November Soybean Futures (1993–2024), daily settlement prices.
Maples, W.E., and G. Gardner. “Using Historical Price Movements to Inform Marketing Decisions.” Southern Ag Today 3(51.1), December 18, 2023. https://southernagtoday.org/2023/12/18/using-historical-price-movements-to-inform-marketing-decisions/
USDA Economic Research Service. Feed Grains Yearbook and Oil Crops Yearbook (ending stocks-to-use).
Recommended citation format: Cortarelli, Julio Bellodi, and Grant Gardner. ” Corn and Soybeans: Is There a Best Month to Price New Crop?” Southern Ag Today 6(41.3). October 7, 2026. Permalink