Authors: Bridget Yeboah Bafowaa, Ph.D. Student, Department of Agricultural Economics and Rural Sociology, Auburn University
Adam N. Rabinowitz, Associate Professor and Extension Economist, Department of Agricultural Economics and Rural Sociology, Auburn University
The United States Department of Agriculture (USDA) recently announced the election and enrollment deadlines for the Price Loss Coverage (PLC) and Agriculture Risk Coverage (ARC) programs for the 2026 and 2027 crop years. For the 2026 crop year, elections and enrollment are open now through December 11, 2026, while the 2027 decision period runs from November 2, 2026, through March 15, 2027 (see USDA 2026). As producers prepare to make these decisions, it is important to recognize that program election can have significant financial implications.
PLC is designed to stabilize income from low prices, while ARC covers revenue shortfalls from a combination of low prices and/or low yields. However, decisions are often cited as difficult for producers and can also be related to prior experiences (Fischer, et al. 2022 and Taylor, et al. 2017). Furthermore, when the enrolled program triggers a lower payment than the alternative, the payment received provides less income support than is optimal.
For the 2025 crop year, producers made decisions under the 2018 Farm Bill parameters prior to April 15, 2025. However, with the passage of the One Big Beautiful Bill Act (OB3) in July 2025, the ARC/PLC program payments for the 2025 crop year were changed to be based on (1) new reference prices, (2) an adjusted ARC formula, and (3) the higher payment rate of ARC or PLC. To illustrate the challenges producers face in making optimal election decisions, this article analyzes the PLC and ARC-County programs for the 2025 crop year. We focus on the outcomes for the five major southern crops: corn, peanuts, soybeans, wheat, and seed cotton for the 13 southern states under the 2018 Farm Bill and under the changes introduced by OB3. For crops within a county that had both irrigated and non-irrigated ARC rates, the overall ARC rate was calculated as the weighted sum of the irrigated and non-irrigated ARC rates, using the respective percentages of irrigated and non-irrigated acreage. For counties and crops designated as “all,” the ARC rate was set equal to the corresponding ARC rate for “all.” There is no consideration of payment limits because our analysis focuses strictly on county-level payment rates.
2018 Farm Bill Elections
The first part of this analysis illustrates the percent of enrolled acres in each program in the southern states that would have received the higher payment rate had the 2018 Farm Bill still been in place for the 2025 crop year payments. As shown in Table 1, the total base acres across the South that were enrolled in ARC was 20,632,981, of which 74.4% are in counties where ARC would have received the higher payment rate under the 2018 Farm Bill. There are, however, vast differences across commodities. Nearly all of the soybean acres that enrolled in ARC would have received the higher payment, but it is vastly less for corn and wheat where only about 2/3 of the ARC enrolled acres would have received the higher payment. Only about 1/3 of ARC enrolled seed cotton and peanut base acres would have had the same outcome. Meanwhile, the outcome for those that enrolled in PLC was less favorable, with only 51.1% of those base acres across the south receiving the higher payment rate. In other words, using 2018 Farm Bill parameters alone (without the OB3 improvements), 48.9% of the base acres enrolled in PLC would have been better off had it been enrolled in ARC for the 2025 crop year. Fortunately for these producers, OB3 created the situation for the 2025 crop year where they will receive the higher of the ARC or PLC payment rate, regardless of their election.
Table 1. Base Acres Enrolled in ARC and PLC for the 2025 Crop Year with Percent Receiving Optimal Payment Rate
| Covered commodity | Total base acres enrolled in ARC | Percent of enrolled base in ARC when ARC would have received the higher payment rate under 2018 Farm Bill | Total base acres enrolled in PLC | Percent of enrolled base in PLC when PLC would have received the higher payment rate under 2018 Farm Bill |
| Corn | 5,699,520 | 62.2% | 2,028,292 | 52.1% |
| Peanuts | 23,417 | 39.2% | 2,253,098 | 51.3% |
| Seed Cotton | 1,324,425 | 30.5% | 9,567,675 | 61.3% |
| Soybeans | 6,586,209 | 99.8% | 566,848 | 10.0% |
| Wheat | 6,999,410 | 68.9% | 7,466,245 | 40.8% |
| Total | 20,632,981 | 74.4% | 21,882,157 | 51.1% |
Payments under the One Big Beautiful Bill Act
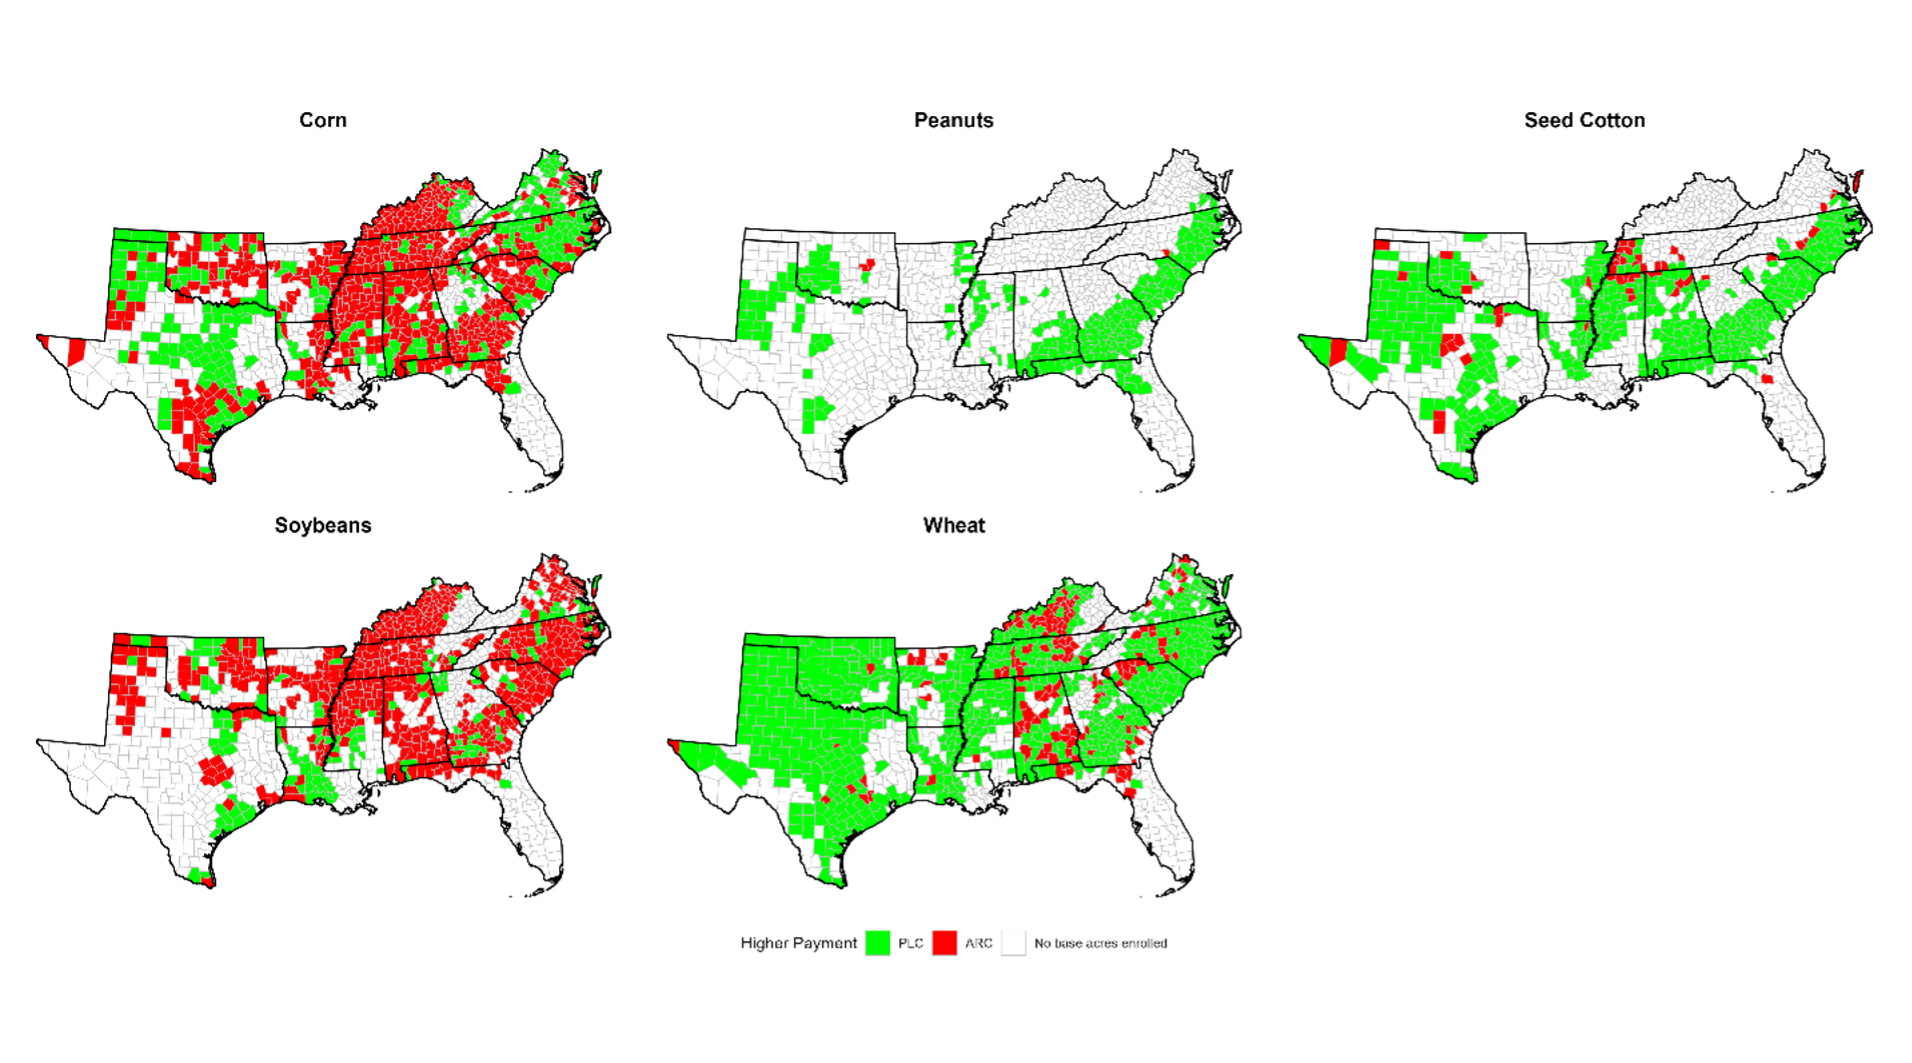
The second part of this analysis focuses on the higher of the ARC or PLC payment rate under the OB3 changes. In this case, the actual enrollment decision does not matter. Figure 1 shows county maps for the selected commodities with shading in green when PLC payment rate is higher and red when the ARC payment rate is higher. For corn and soybeans, the majority of the counties where base acres exist are receiving a higher payment rate under the ARC program; however, there are large areas in Texas, North Carolina, and Virginia where PLC triggered the higher payment rate for corn. Meanwhile, peanuts, seed cotton, and wheat are predominantly being paid under PLC, although areas of Kentucky, Tennessee, and Alabama have many counties where ARC triggered the higher payment rate for wheat. This illustrates the potential under all crops for producers in a given county to benefit more from one program compared to the other. It is also important to note that the analysis in this article is at the county level. While ARC payments for a covered commodity are the same for all producers in a county, PLC varies based on an individual producer’s PLC yield. Figure 1. County Map Illustrating the Higher of the ARC or PLC Payment Rate by Covered Commodity under the One Big Beautiful Bill Act.
Payment Differences between ARC and PLC
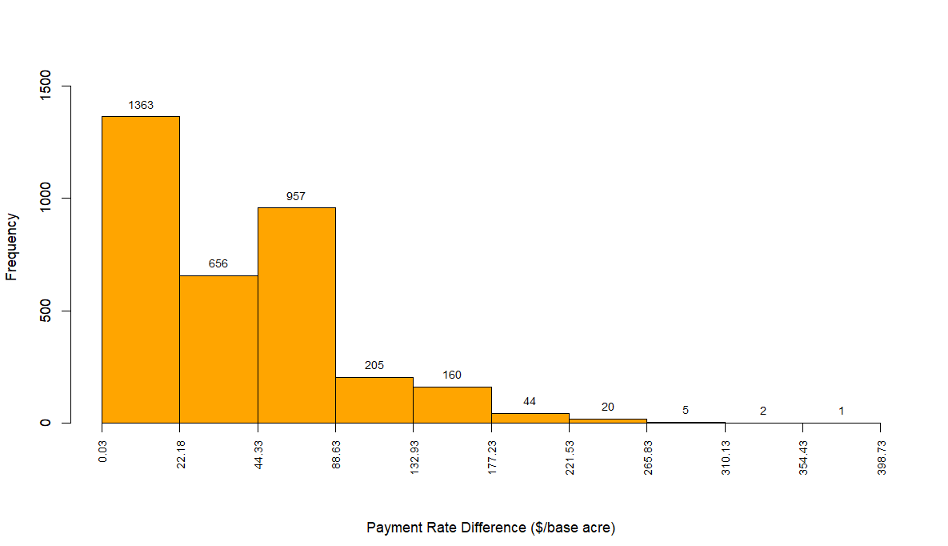
Enrolling in a program that does not generate the maximum payment rate results in a smaller safety net. To quantify the additional payment rate that would result from receiving the higher of ARC or PLC, we calculate the payment difference between the higher payment and the alternative. Figure 2 reports these differences using payment rates calculated under the OB3 provisions. Payment differences vary considerably, with additional payment rates over $350 per base acre for a crop in one county. Smaller additional payment rates were more common. A total of 59.2% of the differences were less than $44.30 per base acre, although only 9.5% were under $5 per base acre. This means that if producers had to make a choice in 2025 under the new OB3 provisions AND they made a choice that did not maximize payments, the payment difference would have been over $44 per base acre over 40% of the time.
Figure 2: Distribution of 2025 Crop Year Payment Rate Differences (Higher Payment Rate minus Alternative Payment Rate) Under One Big Beautiful Bill Act.
Conclusion
This analysis indicates the potential payment inefficiencies producers may face when needing to choose between ARC and PLC. The additional payments can have significant financial implications in covering farm income during times of financial struggles due to low prices or revenue shortfalls. Without changes in legislation, it is important for producers to take the time to make an informed decision regarding their ARC and PLC elections. Several decision guides are available to assist in making decisions, such as the Texas A&M Agricultural and Food Policy Center (AFPC) Decision Tool (Fischer et al., 2026). Even though no decision tool can guarantee the maximum payment, these resources can provide useful information for evaluating the relative advantages of both programs.
Producers should also understand the fundamental differences between ARC and PLC. PLC provides price support and triggers payments when the marketing year average price (MYA) falls below the effective reference price. Conversely, ARC provides revenue support and triggers when revenue falls below a guaranteed revenue level, with revenue determined by county yield (and not individual yield for ARC-County) and MYA prices. Consequently, if producers expect prices to decline while yield remains stable, PLC might be the optimal choice if prices are expected to be low enough to trigger a payment. If a decline in county yields is expected, particularly when accompanied by lower prices, ARC may provide a higher payment. In addition to using a decision guide, producers should consider both their price and yield expectations and the information that is available to them for the crop year when evaluating which programs may provide a greater farm safety net.
References
Fischer, Bart L., Henry L. Bryant, James M. Raulston, and Joe L. Outlaw. 2022. “Simplifying the farm safety net.” Applied Economic Perspectives and Policy 44(3): 1195–1203. https://doi.org/10.1002/aepp.13268
Fischer Bart L., Joe L. Outlaw, Henry L. Bryant, Hank R. Nelson, Natalie Stewart, and J. Marc Raulston. “Making the ARC/PLC Election for the 2026 Crop Year.” Southern Ag Today 6(38.4). September 17, 2026. Permalink
One Big Beautiful Bill Act. (2025). H.R. 1, 119th Cong., 1st sess.
Taylor, Mykel R., Glynn T. Tonsor, Nicholas D. Paulson, Brenna Ellison, Jonathan Coppess, and Gary D. Schnitkey. 2017. “Is it Good to Have Options? The 2014 Farm Bill Program Decisions.” Applied Economic Perspectives and Policy 39(4): 533–546. https://doi.org/10.1093/aepp/ppx044
USDA Farm Service Agency (2026). Agriculture Risk Coverage (ARC) & Price Loss Coverage (PLC). Available at: https://www.fsa.usda.gov/resources/income-support/arc-plc
Recommended citation format: Bafowaa, Bridget Yeboah, and Adam Rabinowitz. “Making the Correct ARC and PLC Decision Can Have Significant Implications on the Safety Net Provided.” Southern Ag Today 6(42.4). October 15, 2026. Permalink