
Authors: Alvaro Durand-Morat, Associate Professor, and Ryan Loy, Assistant Professor and Extension Economist, University of Arkansas
Domestic Market
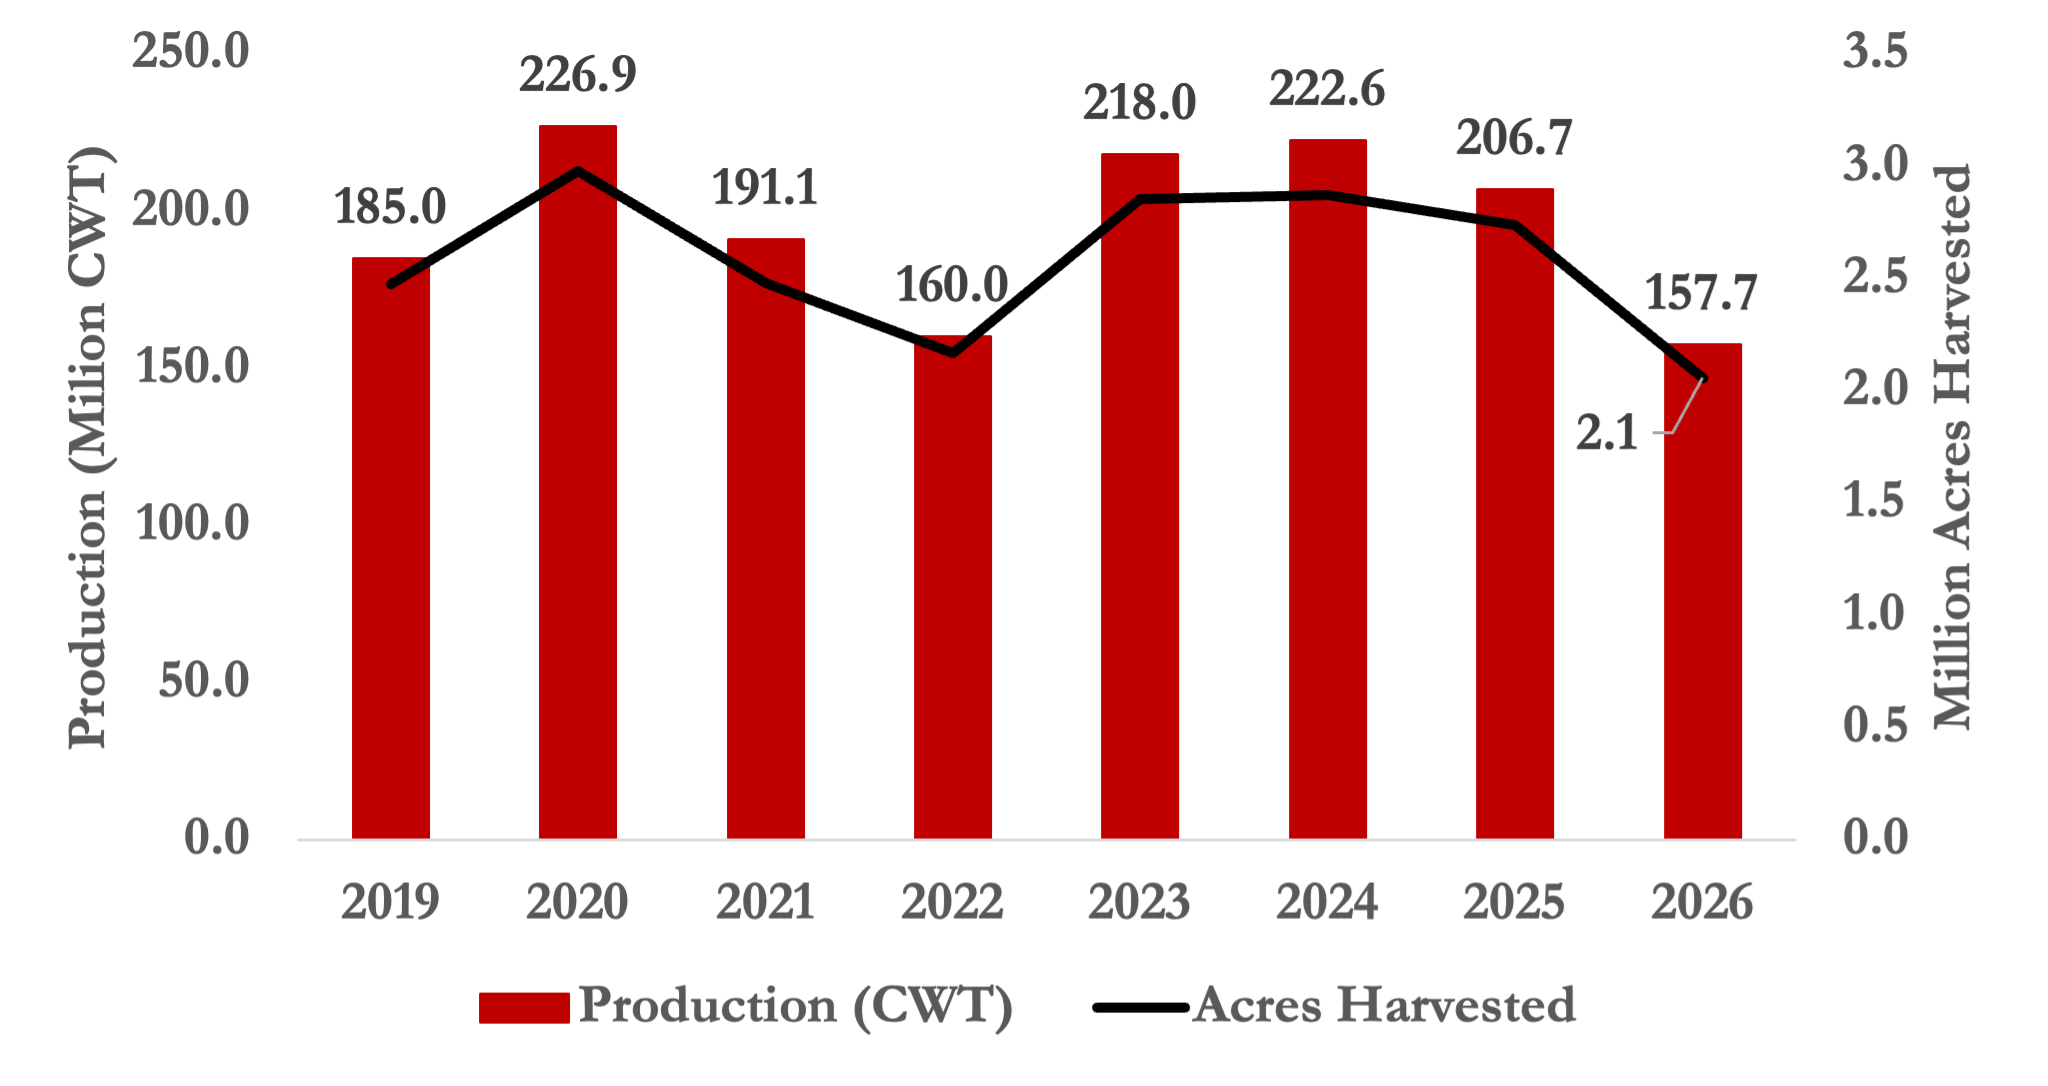
USDA’s October 2026 WASDE further confirmed that the 2026 U.S. rice crop will be one of the smallest in decades. All-rice production is projected at 157.7 million cwt, down 24 percent from last year. Total rice harvested acres fell to roughly 2 million, down 25 percent from 2.74 million in the 2025/26 marketing year (Figure 1). Arkansas saw the largest decline, falling from 1.25 million acres to 886,000 (down 29% YoY). Yields partially offset the acreage loss, though, as the national average is currently forecast at 7,668 pounds per acre, up from 7,544 a year ago but down ~22 pounds from last month due to late-season conditions in the Mississippi Delta region.
Figure 1. United States Rice Production and Acres Harvested (2019 – 2026)
With lower overall supply and use, 2026/27 ending stocks are projected at 40.0 million cwt. The stocks-to-use ratio has tightened, which could provide some upside potential for prices. The all-rice season-average price is projected at $15.20/cwt, up from $12.40 last year. USDA raised its long-grain rice forecast $0.50 this month to $14.00/cwt, on stronger cash and futures values since harvest began.
At the same time, USDA NASS estimates the long-grain price received at just $10.70 per cwt in August 2026. The October WASDE forecast assumes prices will firm up for the rest of the marketing year as the smaller crop comes online. For Mid-South producers, a historically smaller crop, driven by fewer acres, is moving through a tighter balance sheet and pulling long-grain prices up off the multi-year lows seen earlier this year.
International Rice Update
Several factors are providing upside price support globally, among which the ongoing Super El Niño event and the conflict in the Middle East, particularly the situation in the Strait of Hormuz, are arguably the most relevant.
The ongoing Super El Niño event is providing market support because of its potential impact on rice production. For example, in India, the largest rice producer and exporter globally, the southwest monsoon season ended on September 30 with a 12.6% rainfall deficit for June-September, making it the weakest monsoon since 2015 and threatening the productivity and quality of the main Kharif crop (Government of India, 2026). As of October, the USDA projects 2026 rice production to be 4.6% lower than in 2025 (but still 4% higher than the 2021-25 average). The drier-than-usual Summer and Fall in Southeast Asia is also a concern, threatening Vietnam’s Winter-Spring rice crop (which accounts for roughly 45% of the annual production) and Thailand’s secondary crop (which accounts for roughly 20% of the annual production), and creating concerns about the yield and quality of Thailand’s main crop currently under development. The USDA projects a 1.9% and 0.4% decrease in rice production in Thailand and Vietnam, respectively, in 2026. Finally, El Niño is affecting planting progress in Mercosur due to wetter-than-normal conditions. For example, CONAB (Brazil’s National Supply Company) estimates 2026 production would be 3% lower than in 2025, while Argentina and Uruguay face potentially larger losses.
While the situation in the Strait of Hormuz affects the entire economy mainly through crude oil prices, it affects rice trade with Iraq, Kuwait, the UAE, and Qatar, which together account for around 6% of total rice imports in 2023-25. Iraq is particularly important for US long-grain rice—the third-largest export market overall and the second largest for milled rice after Haiti in the last three marketing years.
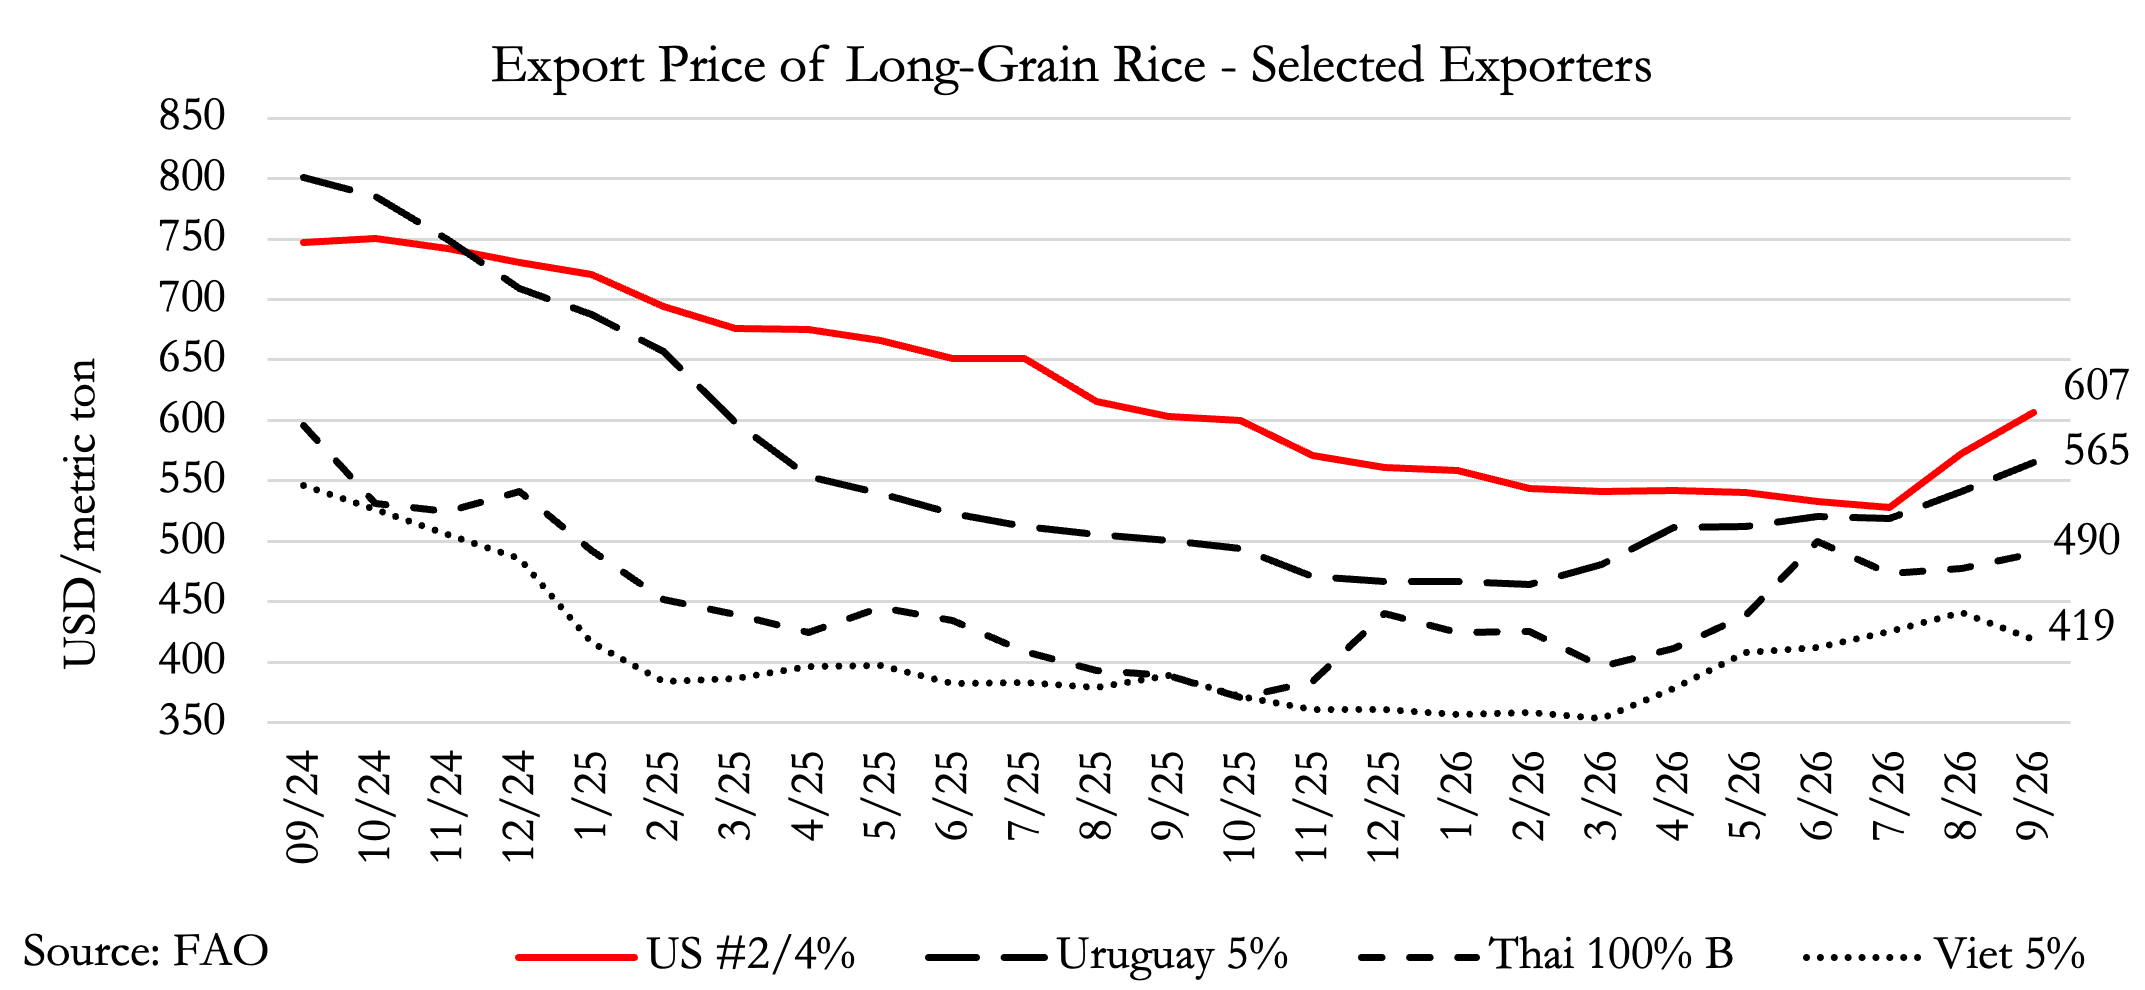
Based on the discussion above, we can infer that international market prices should remain firm in the current marketing year. The FAO indica index, which tracks export prices for long-grain rice from top exporters, grew 15% from March to September, driven by increases in the export price of high-quality long grain from India (10%), Thailand (23%), Vietnam (19%), Uruguay (17%), and the U.S. (12%) (Figure 2). Projections from the Arkansas Global Rice Economics Project (AGREP) point in the same direction, with a projected export (FOB) price for Thai long-grain rice of $453/metric ton (mt) in marketing year 2026, up from $395/mt in 2025. We project the U.S. long-grain export price (US #2/4, FOB Houston) to average $675/mt relative to $569/mt in 2025, and farm prices to reach $14.05/hundredweight in 2026.
The increase in long-grain rice prices in the domestic market is constrained by the ongoing growth in rice imports (mainly aromatic rice). According to the latest WASDE report, rice imports this year are projected to reach 43 million hundredweight (1.95 million mt), amounting to 36.7% of the domestic long-grain market. Imports have grown 134% since 2010, and the trend is not slowing, with projections that the U.S. will become a net importer of long-grain rice (including aromatic rice) by 2035.
In conclusion, current global market conditions support firm prices in the 2026 marketing year, with a high probability of spillover into 2027 if the El Niño event lingers a bit longer. There is always the potential for policy or other interventions to change the price conditions (e.g., will India react to a lower production by banning exports as they did in 2023, leading to further upward support?).
References
AGREP – Arkansas Global Rice Economics Project. Preliminary results from FAPRI’s August 2026 meltdown (unpublished).
CONAB – Companhia Nacional de Abastecimento, Brazil. Boletim da Safra de Grãos. 1º Levantamento – Safra 2026/27.
FAO. FAO Rice Price Update. October 2026. Retrieved from https://www.fao.org/markets-and-trade/commodities/rice/fao-rice-price-update/en/
Government of India. India Meteorological Department. 2026. Salient Features of the 2026 Southwest Monsoon Season. Retrieved from https://mausam.imd.gov.in/Forecast/marquee_data/Salient_Features_SW_MONSOON%20_2026_30_sep.pdf
USDA – World Agricultural Supply and Demand Estimates. 2026. “October 2026 WASDE Report.” Retrieved from https://www.usda.gov/oce/commodity/wasde/wasde1026.pdfUSDA – National Agricultural Statistics Service. 2026. “Agricultural Prices.” Retrieved from https://esmis.nal.usda.gov/sites/default/release-files/796084/agpr0926.pdf