Earlier this year, an article in Southern Ag Today titled The Outlook for Interest Rates in 2026 examined how interest rates might change in 2026 based on the Federal Open Market Committee’s (FOMC) Summary of Economic Projections. This article reviews those early-2026 projections, compares them with the FOMC’s actual policy decisions, and discusses what changes in the economic environment might mean for interest rates in 2027.
Table 1 summarizes the economic projections of the twelve FOMC members at the December 2025 and March 2026 meetings. At the start of the year, most FOMC members believed a federal funds rate between 2.9% and 3.6% was the appropriate path for 2026. At the time, the FOMC’s target range for the federal funds rate was 3.5%- 3.75%, implying a single quarter-point rate cut in 2026 was likely. However, at its September meeting, the FOMC raised the federal funds rate target range by a quarter point to 3.75%-4.0%. In addition, the FOMC’s September Summary of Economic Projections indicated that most members now favored a federal funds rate between 4.0% and 4.4% in 2026 (Table 2).
Two factors likely explain the change in the FOMC’s monetary policy path. First, the FOMC’s composition changed this year. In May, Kevin Warsh replaced Jerome Powell as the Chair of both the Federal Reserve and the FOMC. At the same time, four regional Federal Reserve bank presidents rotated off the committee, and four new presidents joined, as is standard practice each year. The addition of five new members may have shifted the board’s composition, leading to a more hawkish stance on inflation.
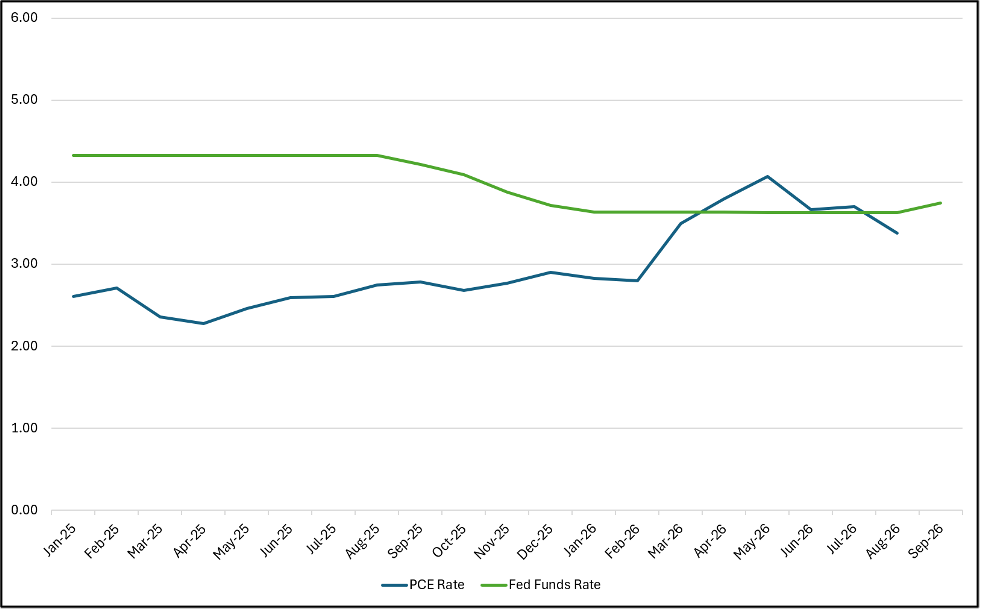
The second factor likely influencing the FOMC’s decisions this year is the trajectory of inflation in 2026, as shown in Figure 2. In January, annual inflation in the Personal Consumption Expenditures (PCE) index, the FOMC’s preferred measure of inflation, was 2.73%. By August, annual inflation had risen to 3.45% due to higher tariffs, the Middle East conflict, and resulting increases in input and energy costs across multiple sectors of the economy (FOMC 2026). These events put pressure on the FOMC to reverse course and raise the federal funds rate.
What does this mean for the final two months of 2026 and into 2027? The most likely scenario is higher rates, at least in the short term. If the FOMC’s September projections are accurate, a quarter-point increase at its December meeting would not be unexpected. The long-term outlook is less certain. According to the September summary, the median projection is for the federal funds rate to hold steady at 4.1% next year. How the FOMC manages monetary policy will depend on inflation’s trajectory and the economy’s strength. If the U.S. economy shows signs of a recession, the FOMC may feel compelled to lower rates.
If the FOMC raises the federal funds rate in December and keeps the target rate between 4.0% and 4.25% in 2027, expect higher agricultural loan rates as well. Agricultural rates rose in the third quarter of 2026, possibly in anticipation of the committee’s September decision. Figure 2 offers insight into where agricultural rates may end up next year. For most of 2025, the FOMC held the federal funds rate steady between 4.25% and 4.5%. At the same time, long- and intermediate-term agricultural rates were near 8.0%, while short-term rates were closer to 8.5%. The actual rate a borrower receives will depend on their relationship with the lender and their perceived creditworthiness; however, as producers begin planning for 2027, they should expect to pay higher interest rates on operating loans next year.
Table 1. Summary of FOMC Committee Member Projections, December 2025 and March 2026
| Median (%) | Central Tendency (%)1 | Range (%) | ||||
| December | March | December | March | December | March | |
| Change in Real GDP | 2.3 | 2.3 | 2.1 – 2.5 | 2.2 – 2.5 | 2.0 – 2.6 | 2.1 – 2.7 |
| Unemployment Rate | 4.4 | 4.4 | 4.3 – 4.4 | 4.3 – 4.5 | 4.2 – 4.6 | 4.3 – 4.6 |
| PCE Inflation | 2.4 | 2.7 | 2.3 – 2.5 | 2.6 – 3.1 | 2.2 – 2.7 | 2.3 – 3.3 |
| Federal Funds Rate | 3.4 | 3.4 | 2.9 – 3.6 | 3.1 – 3.6 | 2.1 – 3.9 | 2.6 – 3.6 |
| 1 The central tendency represents the range of projections, excluding the 3 highest and 3 lowest values. | ||||||
Table 2. Summary of FOMC Committee Member Projections, September 2026
| Median (%) | Central Tendency (%)1 | Range (%) | ||||
| 2026 | 2027 | 2026 | 2027 | 2026 | 2027 | |
| Change in Real GDP | 2.3 | 2.4 | 2.2 – 2.4 | 2.2 – 2.6 | 2.1 – 2.6 | 2.0 – 2.9 |
| Unemployment Rate | 4.1 | 4.1 | 4.1 – 4.2 | 4.0 – 4.2 | 4.0 – 4.3 | 4.0 – 4.5 |
| PCE Inflation | 3.7 | 2.3 | 3.5 – 3.7 | 2.2 – 2.5 | 2.9 – 3.8 | 2.0 – 2.6 |
| Federal Funds Rate | 4.1 | 4.1 | 4.1 – 4.4 | 3.6 – 4.4 | 3.9 – 4.4 | 3.1 – 4.4 |
| 1 The central tendency represents the range of projections, excluding the 3 highest and 3 lowest values. | ||||||
Figure 1. Agricultural Loan Rates, Q1 2023 – Q3 2026
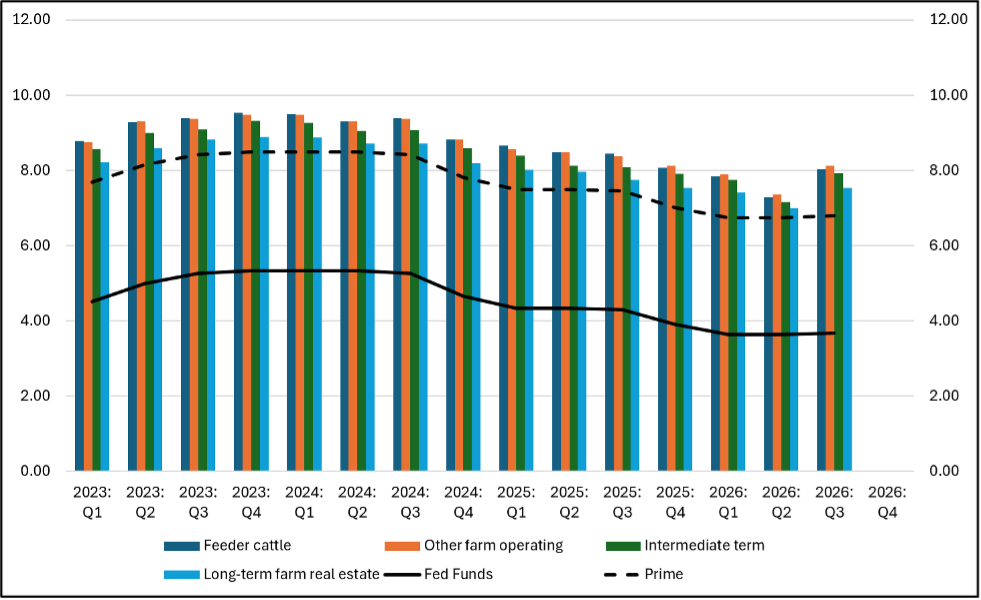
Figure 2. Annual Personal Consumption Expenditures Index (measure of Inflation) compared to the Federal Funds Rate, January-August 2026
References
Board of Governors of the Federal Reserve System (US), Federal Funds Effective Rate [FEDFUNDS], retrieved from FRED, Federal Reserve Bank of St. Louis; https://fred.stlouisfed.org/series/FEDFUNDS.
Board of Governors of the Federal Reserve System (US), Bank Prime Loan Rate [MPRIME], retrieved from FRED, Federal Reserve Bank of St. Louis; https://fred.stlouisfed.org/series/MPRIME.
Board of Governors of the Federal Reserve System (US), Agricultural Survey, retrieved from the Federal Reserve Bank of Dallas; https://www.dallasfed.org/research/surveys/agsurvey.
Board of Governors of the Federal Reserve System (US), December 30, 2025: FOMC Projections Materials, Accessible Version. Retrieved from: https://www.federalreserve.gov/monetarypolicy/fomcprojtabl20251210.htm.
Board of Governors of the Federal Reserve System (US), March 18, 2026: FOMC Projections Materials, Accessible Version. Retrieved from: https://www.federalreserve.gov/monetarypolicy/fomcprojtabl20260318.htm.
Board of Governors of the Federal Reserve System (US), September 16, 2026: FOMC Projections Materials, Accessible Version. Retrieved from: https://www.federalreserve.gov/monetarypolicy/fomcprojtabl20260916.htm.
Board of Governors of the Federal Reserve System (US), September 16, 2026: Minutes of the Federal Open Market Committee. Retrieved from: https://www.federalreserve.gov/monetarypolicy/fomcminutes20260916.htm.
U.S. Bureau of Economic Analysis, Personal Consumption Expenditures: Chain-type Price Index [PCEPI], retrieved from FRED, Federal Reserve Bank of St. Louis; https://fred.stlouisfed.org/series/PCEPI.