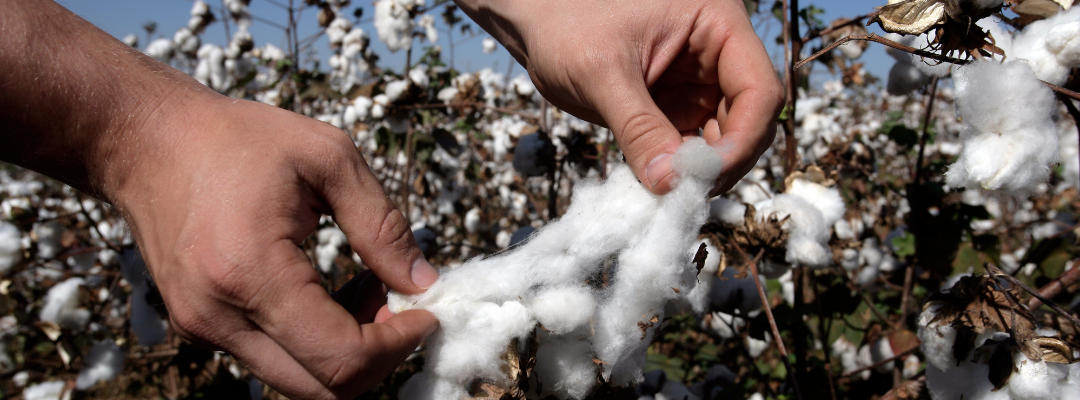
U.S. cotton is historically in relatively poorer shape this year. According to the USDA Crop Progress report, only 41% of cotton acreage is rated to be in good or excellent condition as of the first week of August, which ranks 5th worst over the past twenty years. This is driven by Texas – the largest producing cotton state – which has 55% of its acreage in poor or very poor condition. Therefore, it is not a huge surprise that the USDA lowered its cotton production forecast this year. As of the August Crop Production report, U.S. average upland cotton yield for 2023 is projected at just 773 lb. per acre, which if realized would be the fourth lowest yield in the last twenty years. The USDA also forecasts 8.5 million upland cotton acres to be harvested, which would suggest the abandonment rate – or percentage of planted acres that go unharvested – to equal 22%. Let’s look into the accuracy of the USDA’s August cotton acreage and yield forecasts in recent years to further understand where cotton production might end up.
Figure: Final Cotton Yield and Abandonment Rate with August Forecast Errors by Year
a) Final Cotton Yield and August Forecast Error

Note: Forecast error = Final Yield minus August Yield Forecast
b) Final Abandonment Rate and August Forecast Error

Note: Forecast error = Final Yield minus August Yield Forecast
Where is cotton production likely to end up? The above figure (panel a) shows annual ending cotton yield and the difference between the final yield and the August forecast, or the August forecast error. Cotton yields have been within 10% of the August prediction in fourteen of the past nineteen years, averaging a miss of just 2%. On average, cotton yield has ended up 20.9 lb. per acre higher than what was forecast in August. Abandonment was more difficult to predict, with the average year seeing the abandonment rate two percentage points higher than forecast in August, an 11% miss (panel b). Abandonment rates ended up higher than predicted in fifteen out of nineteen years, meaning that harvested acreage wound up lower than forecast.
Now what can history tell us about where production might end up in 2023? Let’s consider some low- and high-production scenarios from the previous nineteen years. Consider storm-plagued 2020 as a low-production year, which forecast 929 lb. per acre yields and a 24% abandonment rate in August but wound up with 841 lb. per acre and a 33% abandonment rate. As a result, production fell over 3 million bales short of what was forecast. An identical error to 2020 would result in yields 11% lower and an abandonment rate 6 percentage points higher, resulting in 11.0 million bales of production in 2023 (see table below). On the other hand, two years (2005 and 2022) both saw one-percentage point decreases in the abandonment rate and 11% increases in yield over what was forecast, and 2 million bales of unexpected production. A similar scenario this year would result in 15.4 million bales of production. This large range in potential outcomes could lead to additions or reductions to the forecast 2.99 million bale ending stocks, ultimately affecting the 79 cent per lb. marketing year price forecast. However, it is important to note that cotton use would likely be adjusted downward primarily through exports in a low-production scenario which would prevent cotton stocks from cratering.
Table 2: 2023/24 Cotton Production Scenarios Given Recent Forecast History
| 2022/23E | 2023/24F | |||
| August WASDE | Low Production | High Production | ||
| Planted Acres | 13.6 | 11.1 | 11.1 | 11.1 |
| Harvested Acres | 7.1 | 8.5 | 7.6 | 8.7 |
| Yield per Harvested Acre (lb. per acre) | 942.0 | 773.0 | 695.7 | 858.0 |
| Production (million bales) | 14.0 | 13.7 | 11.0 | 15.4 |
Sources
USDA-NASS. Crop Production. August 11, 2023. Available at: https://downloads.usda.library.cornell.edu/usda-esmis/files/tm70mv177/2227p6419/w3764r31w/crop0823.pdf
USDA-NASS. Crop Progress. August 7, 2023. Available at: https://downloads.usda.library.cornell.edu/usda-esmis/files/8336h188j/f7624v982/ff366p28b/prog3123.pdfUSDA. World Agricultural Supply and Demand Estimates. August 11, 2023. Available at: https://downloads.usda.library.cornell.edu/usda-esmis/files/3t945q76s/8c97n5538/6w925t710/wasde0823.pdf
Sawadgo, Wendiam. “How is the Cotton Crop Looking in 2023?” Southern Ag Today 3(34.1). August 21, 2023. Permalink

