
You may have heard the saying, “You can’t unscramble an egg.” While that’s true, it may be possible to make sense of broiler egg set data and what it could indicate for future production. By examining trends in eggs set at U.S. hatcheries and comparing them with broiler market prices, we can gain insight into likely chick placements and poultry meat production several months ahead. For contract growers, these trends can provide clues about future flock placement scheduling.
Understanding the Cycle
From the time an egg is set in a hatchery until the bird is processed typically takes 9 to 12 weeks, depending on target market weight. Once eggs enter the hatchery, plans for placement and processing have largely been made.
Today, more than 95 percent of U.S. broilers are produced under coordinated marketing systems in which poultry companies have already secured buyers long before eggs are set. These customers include grocery retailers, food distributors, and restaurant chains. Many agreements are long-term exclusive contracts at premium pricing to ensure a reliable product supply for the buyer. Some are structured on a “cost-plus” basis at a negotiated margin above cost, further insulating poultry companies from market risks.
This highly coordinated, closely connected supply chain contributes to industry stability and generally results in consistent bird placements for contract growers. As a result, flock schedules are often influenced more by company-specific marketing commitments, or by local circumstances than by short-term national market conditions.
What Does the Composite Broiler Price Tell Us?
The USDA Composite Broiler Price (CBP) is an average of reported negotiated prices for broiler products. While it does not represent the price received for most broilers sold, it serves as a useful indicator of overall market conditions.
Historically, the CBP follows a somewhat seasonal pattern (Figure 1). Prices often strengthen during late spring and summer when chicken demand is highest and typically weaken later in the year. A shorter-lived increase often occurs during the holiday season.
The 2020-2024 average and 2025 price pattern generally followed this trend. In contrast, 2026 prices have been much flatter throughout. Although prices remained below 2025 highs, they are significantly higher than the long-term average and demand has kept them relatively stable. One factor supporting chicken demand is the continued increase in competing protein prices, particularly beef, which has encouraged many consumers to choose lower-cost poultry products.
What Are Egg Set Numbers Indicating?
Compared with 2025, broiler egg sets have remained higher through most of 2026 (Figure 2). However, the gap has narrowed in recent weeks, and the number of eggs set has slowed compared with last year’s relatively flat trend.
Several factors could explain this change. Lower market prices may be encouraging some production restraint. Another possibility is that hatchability has improved. The broiler industry has experienced hatchability challenges in recent years, requiring more eggs to be set to produce enough chicks. As hatchability improves, fewer eggs may be needed to achieve the same number of placements.
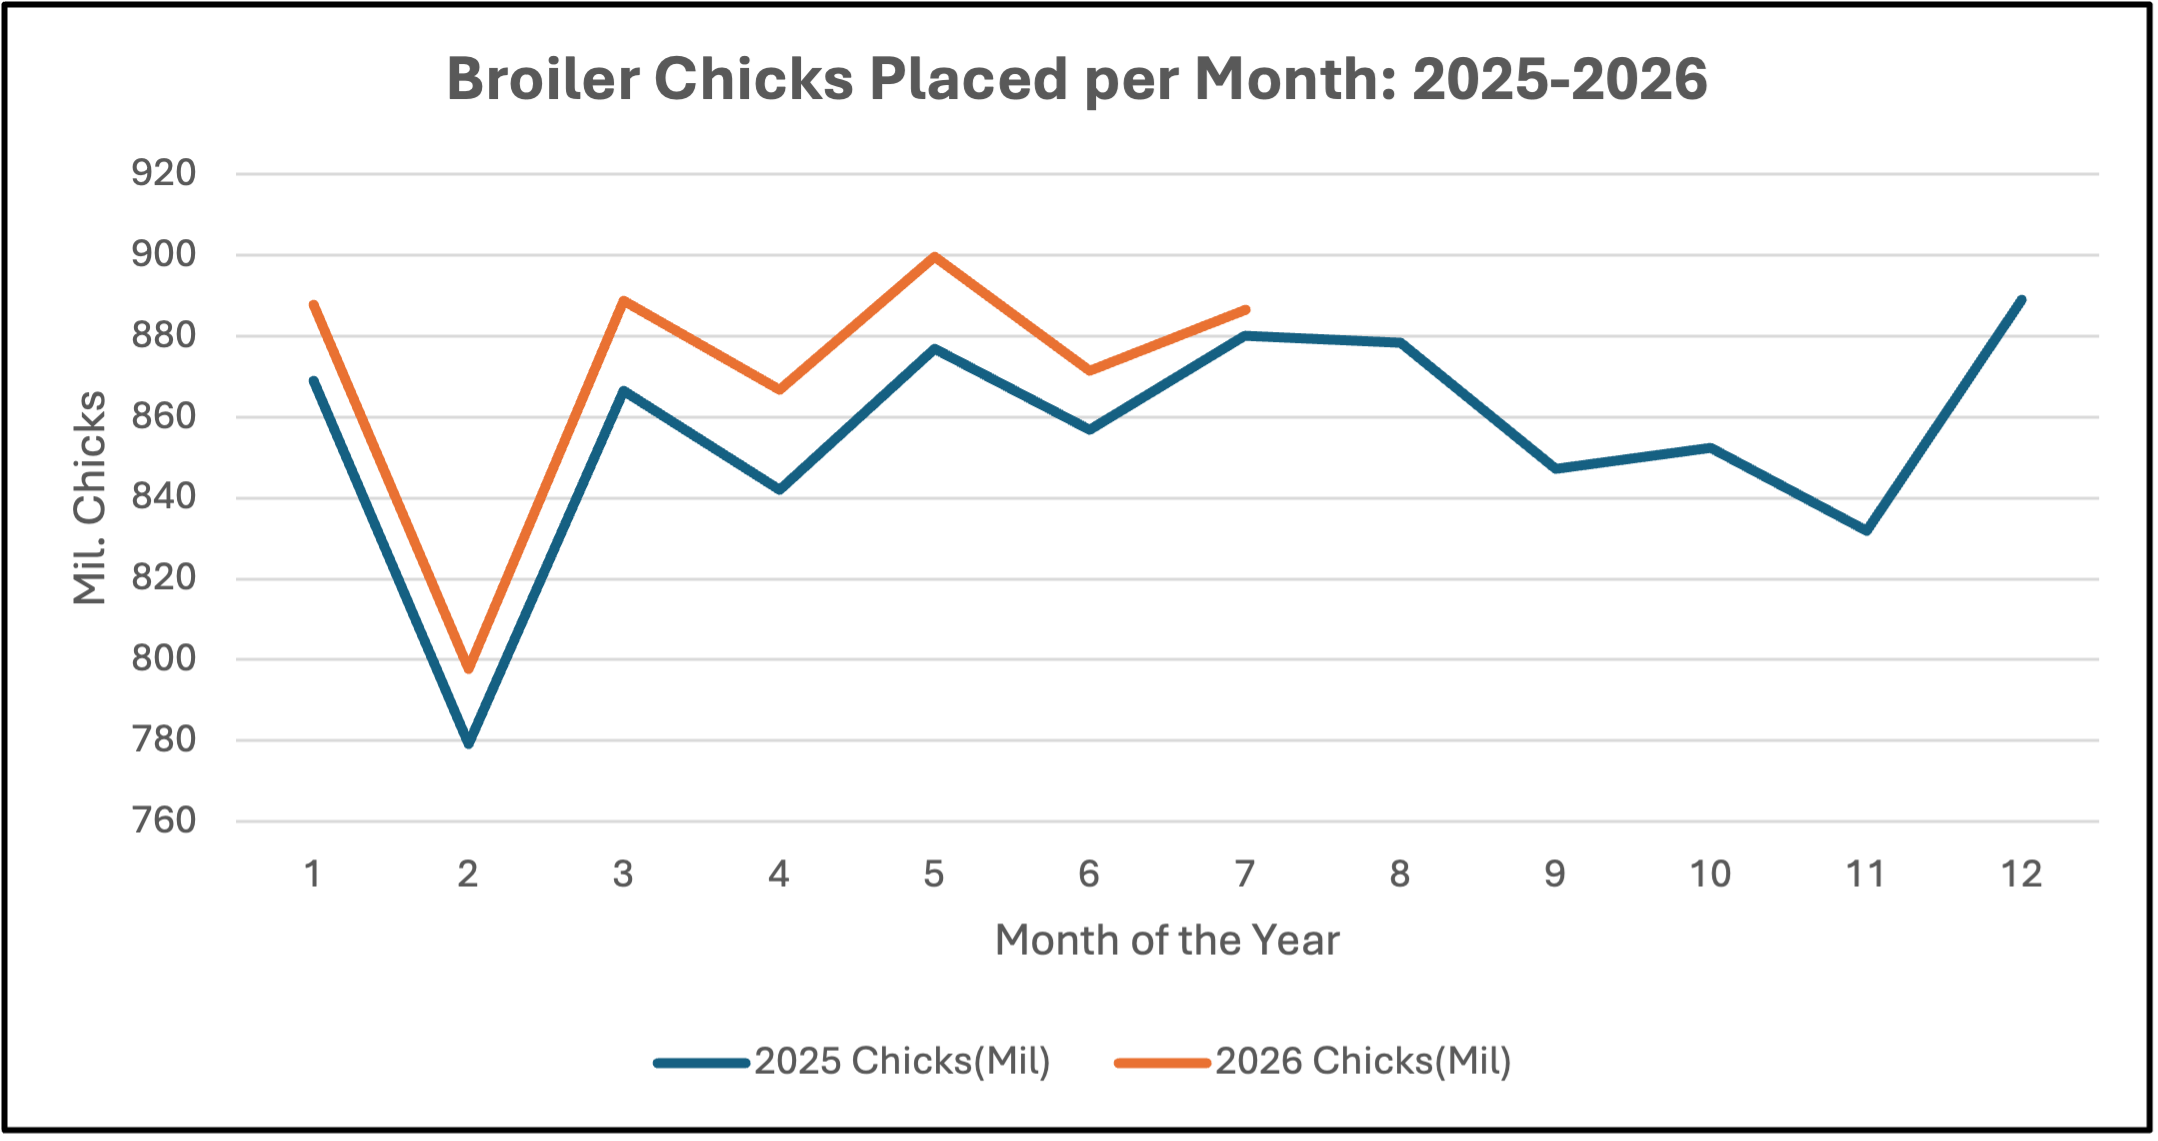
Chick placements continue to run above 2025 levels (Figure 3), although recent differences have become much smaller. Overall placements in 2026 are averaging about 2.1 percent above last year, while July placements were only 0.7 percent higher than July 2025.
Outlook for Growers
At present, there is little evidence that contract growers should expect major changes in bird placements at the national level. Local conditions and individual company marketing strategies will continue to have the greatest influence on individual grower’s flock schedules.
If chicken demand remains supported by high prices for competing proteins, egg set numbers could gradually increase later in the year, limited primarily by breeder hen inventories and chick availability. For now, industry trends appear generally consistent with normal seasonal patterns, suggesting relatively stable production and placement levels throughout the remainder of 2026.
Figure 1. The USDA Composite Broiler Price represents an average of reported negotiated broiler prices. It does not necessarily reflect the actual price received for most broiler products sold.
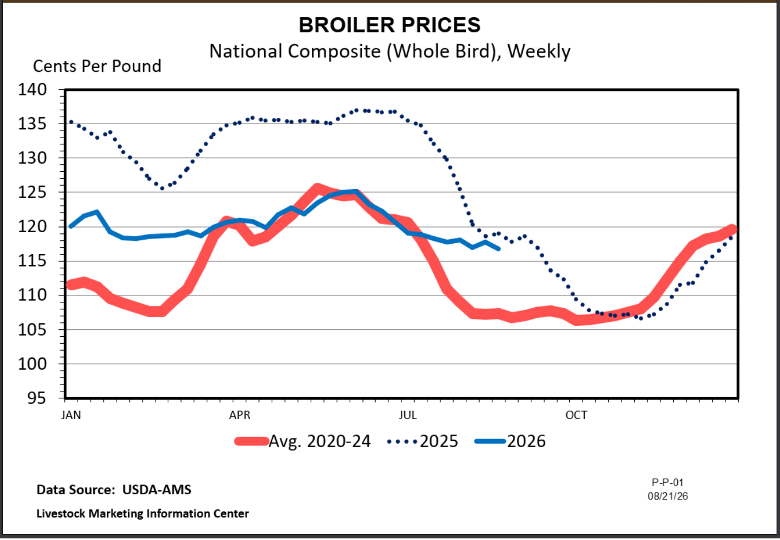
Figure 2. U.S. broiler egg sets remained above 2025 levels through most of 2026 but have recently moved closer to last year’s pace. Along with softening prices, improved hatchability may be reducing the number of eggs required to produce sufficient chicks. (USDA-NASS)
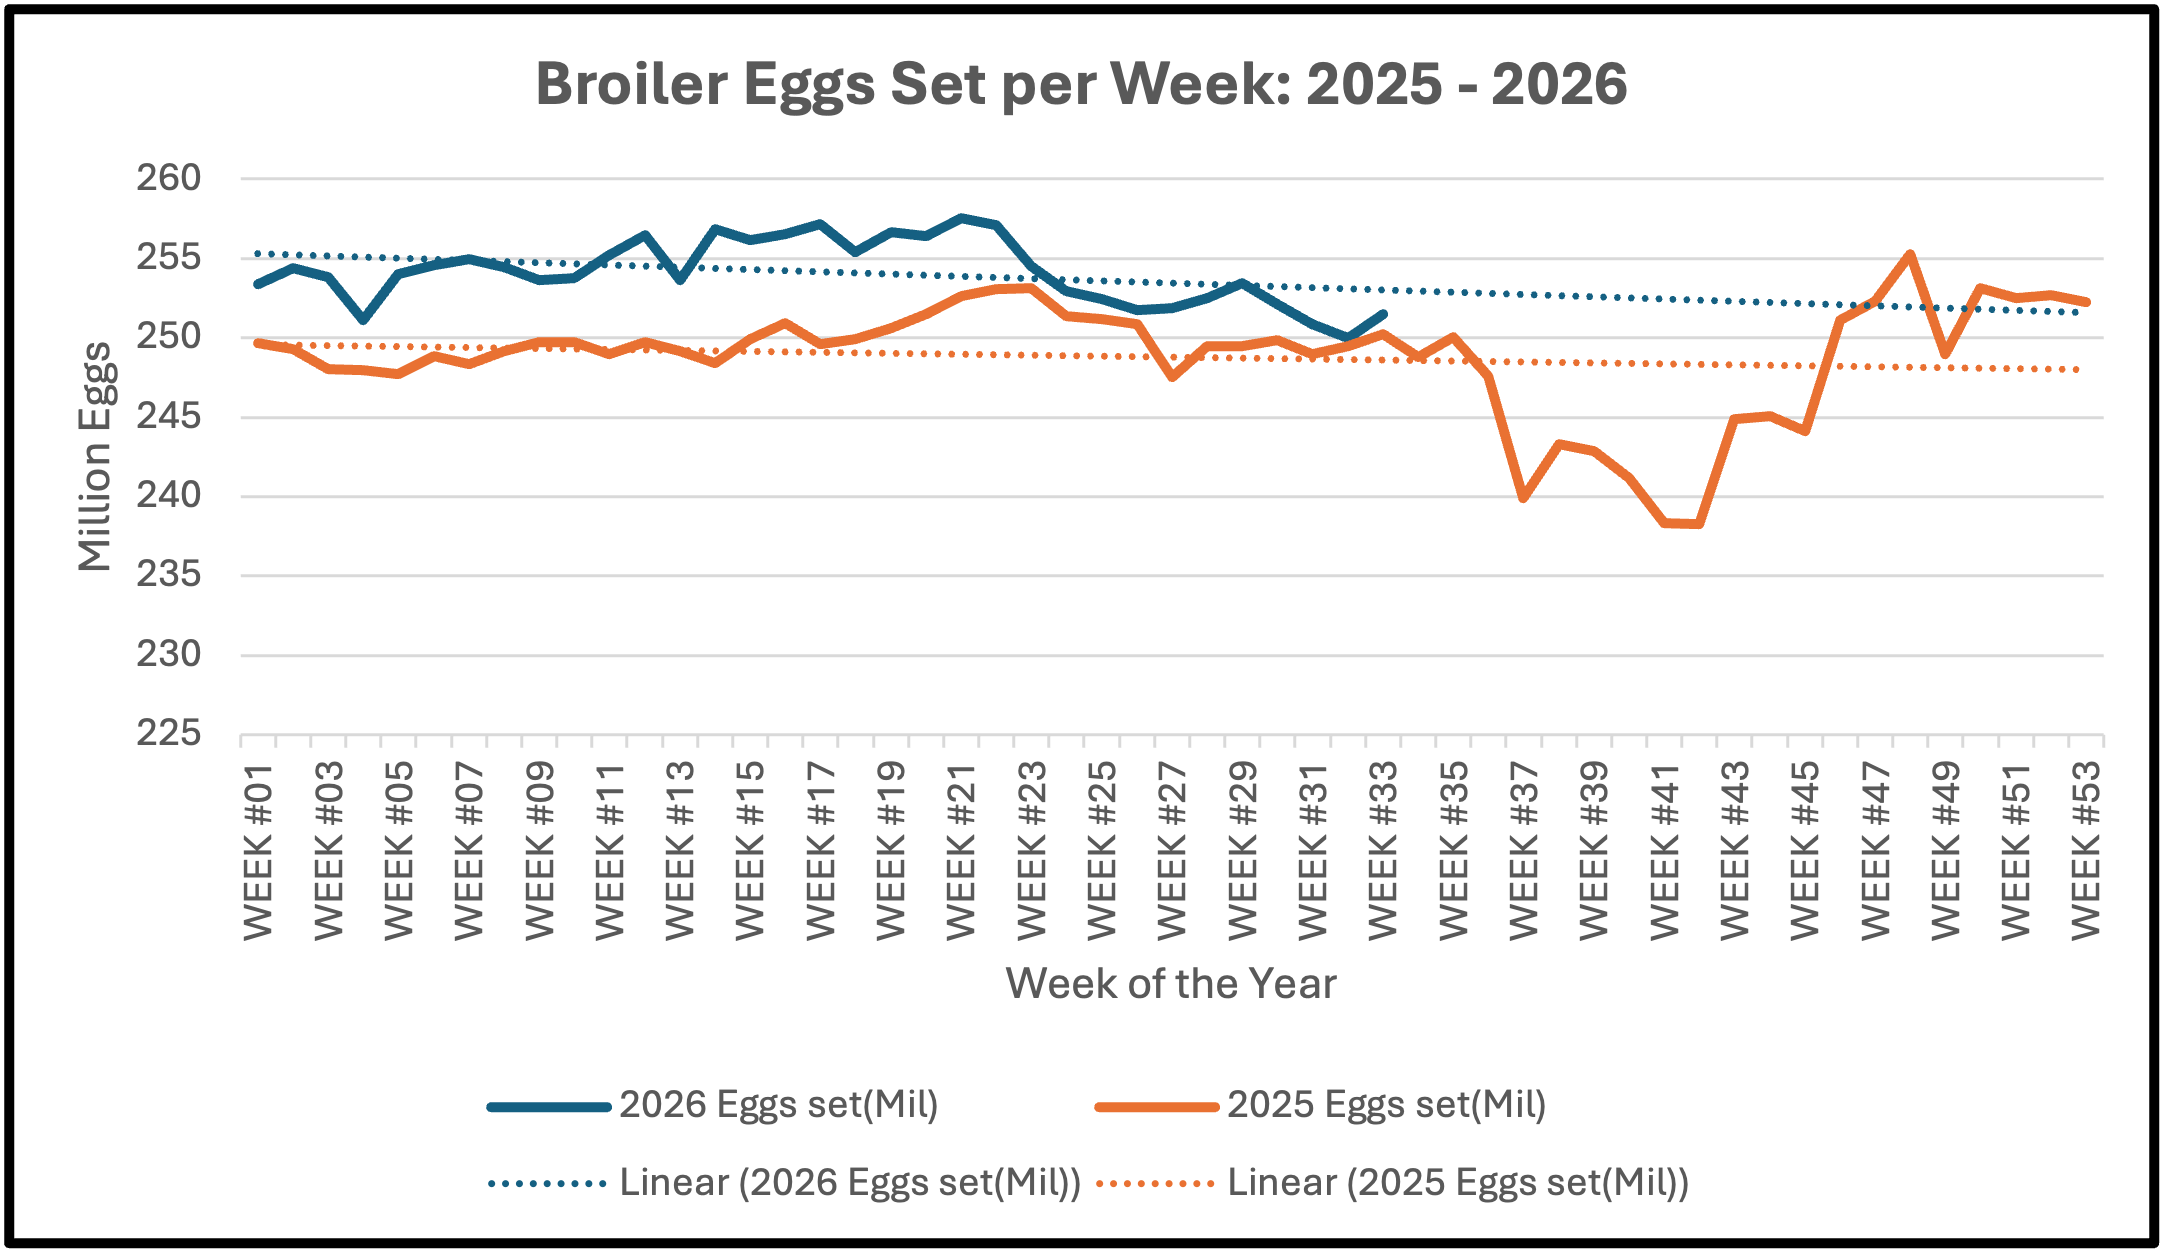
Figure 3. Broiler chick placements in 2026 have averaged 2.1% above 2025 levels, although recent monthly differences have narrowed. July 2026 placements were only 0.7% higher than July 2025. (USDA-NASS)
Recommended citation format: Brothers, Dennis. “Un-Scrambling Broiler Egg Set Data.” Southern Ag Today 6(37.2). September 8, 2026. Permalink