
Authors: Dr. Hunter D. Biram, Assistant Professor and Extension Agricultural Economist, University of Arkansas, Mr. Enil Serrano Puerto, Ph.D. Student, University of Kentucky, Dr. Grant Gardner, Assistant Extension Professor, University of Kentucky
The Federal Crop Insurance Program (FCIP) has been a standard in farm risk management with nearly 500 million acres insured across row crops, forages, and specialty crops, resulting in up to $192 billion in insured liability in 2024, or 78% of the total value of U.S. crops (USDA-RMA and USDA-ERS, 2026). Despite its popularity as a risk management tool, the question of the best coverage level remains each year. Because premium rates are capped at annual increases of 20%, base premiums tend to change very little from year to year. However, the expected insurance price used to calculate coverage is influenced by futures market prices. As a result, insurance costs can fluctuate based on changes in commodity prices and the mix of crop acres planted by producers. This often leaves farmers with the question of how much insurance to buy or whether to renew with the same coverage from the year before. In response, a large suite of tools has been developed by university extension services. A total of 13 decision aids have been developed by universities from across the U.S., with 9 focusing on farm programs (i.e., Agriculture Risk Coverage and Price Loss Coverage) administered by the Farm Service Agency (FSA), and 4 focusing on federal crop insurance programs administered by the Risk Management Agency (RMA) (Serrano, Gardner, and Biram, Forthcoming). We add a decision aid to this suite of tools that provides analysis for both FSA farm programs and federal crop insurance programs, the Crop Insurance Decision-Maker (CIDM). The CIDM is a free, web-based decision aid that provides expected revenue net of production expenses and insurance premiums paid under scenarios with and without crop insurance. After analyzing multiple scenarios, the CIDM highlights the risk management option with the highest expected net return as a potential optimal coverage choice. The tool further provides analysis of farmer risk preferences by including data for farmers who are risk-averse and are concerned about extreme weather and pest pressure lowering expected net returns.
In an article published in the latest edition of the Journal of the American Society of Farm Managers and Rural Appraisers (JASMFRA), Serrano, Gardner, and Biram (2026) provide an explanation for CIDM, how to interpret the results in the decision aid, how the results were generated, and where it fits in the greater suite of farmer decision aids. In most instances, results follow those of Biram et al. (2022), who show that even in the presence of ARC and PLC, the optimal decision in most cases is to choose 80-85% coverage. Biram et al. (2022) show that the base premium rate drives the coverage level, with higher base premiums resulting in increasing cost of insurance, and therefore lower optimal coverage levels.
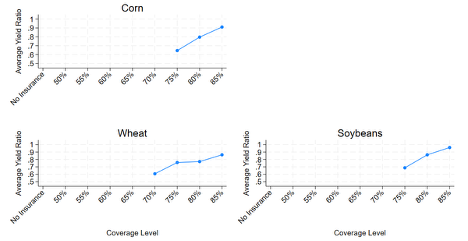
We suggest here that another driver of optimal coverage is the ratio of the farm-level yield expectation, measured by the Actual Production History, to the county-level yield expectation measured by the county Reference Yield determined by RMA. Using Arkansas and Kentucky as examples, Figures 1 and 2 plot optimal coverage levels for risk-averse farmers across various yield ratio levels based on Serrano, Gardner, and Biram (2026). We first note that in all instances, except for cotton grown in one county in Arkansas, purchasing some level of crop insurance is always preferred to not purchasing any crop insurance at all (see Figures 1-2). We also find that the optimal coverage level is at least 70% or greater when the farm-level yield expectation is at least half that of the county yield expectation for Arkansas (Figure 1) or the farm yield expectation is at least 60% of the county yield expectation in Kentucky.
Since these general results are across multiple combinations of states, counties, and coverages, we direct farmers and other users involved in the crop insurance purchase process to consult the CIDM for optimal coverage in a specific county.
Figure 1. The Relationship Between the Yield Ratio and Optimal Coverage Level in Arkansas
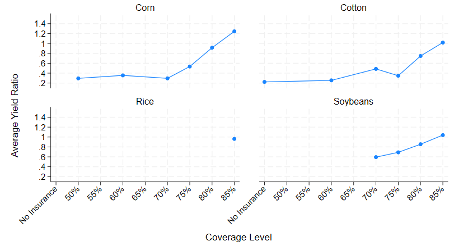
Figure 2. The Relationship Between the Yield Ratio and Optimal Coverage Level in Kentucky
References
Biram, H. D., Coble, K. H., Harri, A., Park, E., & Tack, J. (2022). Mitigating price and yield risk using revenue protection and agriculture risk coverage. Journal of Agricultural and Applied Economics, 54(2), 319-333.
Serrano, E., Gardner, G., & Biram, H.D. (2026). Enhancing Crop Insurance Decisions with Data-Driven Tools. Journal of the American Society of Farm Managers and Rural Appraisers.
United States Department of Agriculture, Economic Research Service. (Accessed 2026). Farm income and wealth statistics.
United States Department of Agriculture, Risk Management Agency. (Accessed 2026). Revised premium ratings for corn and soybeans: Frequently asked questions.
