
The United States Department of Agriculture (USDA) released the November World Agricultural Supply and Demand Estimates (WASDE) report on Tuesday, November 10. The main question heading into the report was what USDA would do with yields, especially after a September revision to corn production was announced in late October. This article recaps the changes for corn, soybeans, cotton and rice, and then looks at how much yields have typically changed between November and the final estimates in January.
November Report Recap
USDA lowered its projected corn yield by 1.6 bushels to 179.6 bushels per acre. That reverses most of October’s increase from 178.5 to 181.2 bushels and leaves the yield 3.4 bushels below USDA’s initial May projection of 183 bushels. Production fell 141 million bushels to 15.9 billion bushels. USDA also trimmed exports and feed and residual use by 25 million bushels each, so ending stocks fell 91 million bushels to 1,758 million bushels. The season-average farm price was lowered 10 cents to $4.60 per bushel.
Soybean yields were raised slightly, up 0.2 bushels to 53.3 bushels per acre, adding 12 million bushels of production. A 25 million bushel increase in exports more than offset the larger crop, and ending stocks fell 15 million bushels to 300 million bushels. The season-average price was raised 10 cents to $12.10 per bushel.
USDA lowered the cotton yield by 15 pounds to 775 pounds per acre, cutting production by 260,000 bales to 13.18 million bales. Domestic use was lowered 100,000 bales and exports were unchanged at 12.3 million bales. Ending stocks fell 100,000 bales to 3.7 million bales. The season-average price was lowered 1 cent to 76 cents per pound.
Rice changed little. The yield was lowered 4 pounds to 7,664 pounds per acre, while production was nearly unchanged at 157.6 million hundredweight, and ending stocks fell 100,000 hundredweight to 39.9 million hundredweight. The season-average price was lowered 10 cents to $15.10 per hundredweight, but long-grain price was unchanged at $14.00 per hundredweight.
How Much Could Yields Change by January?
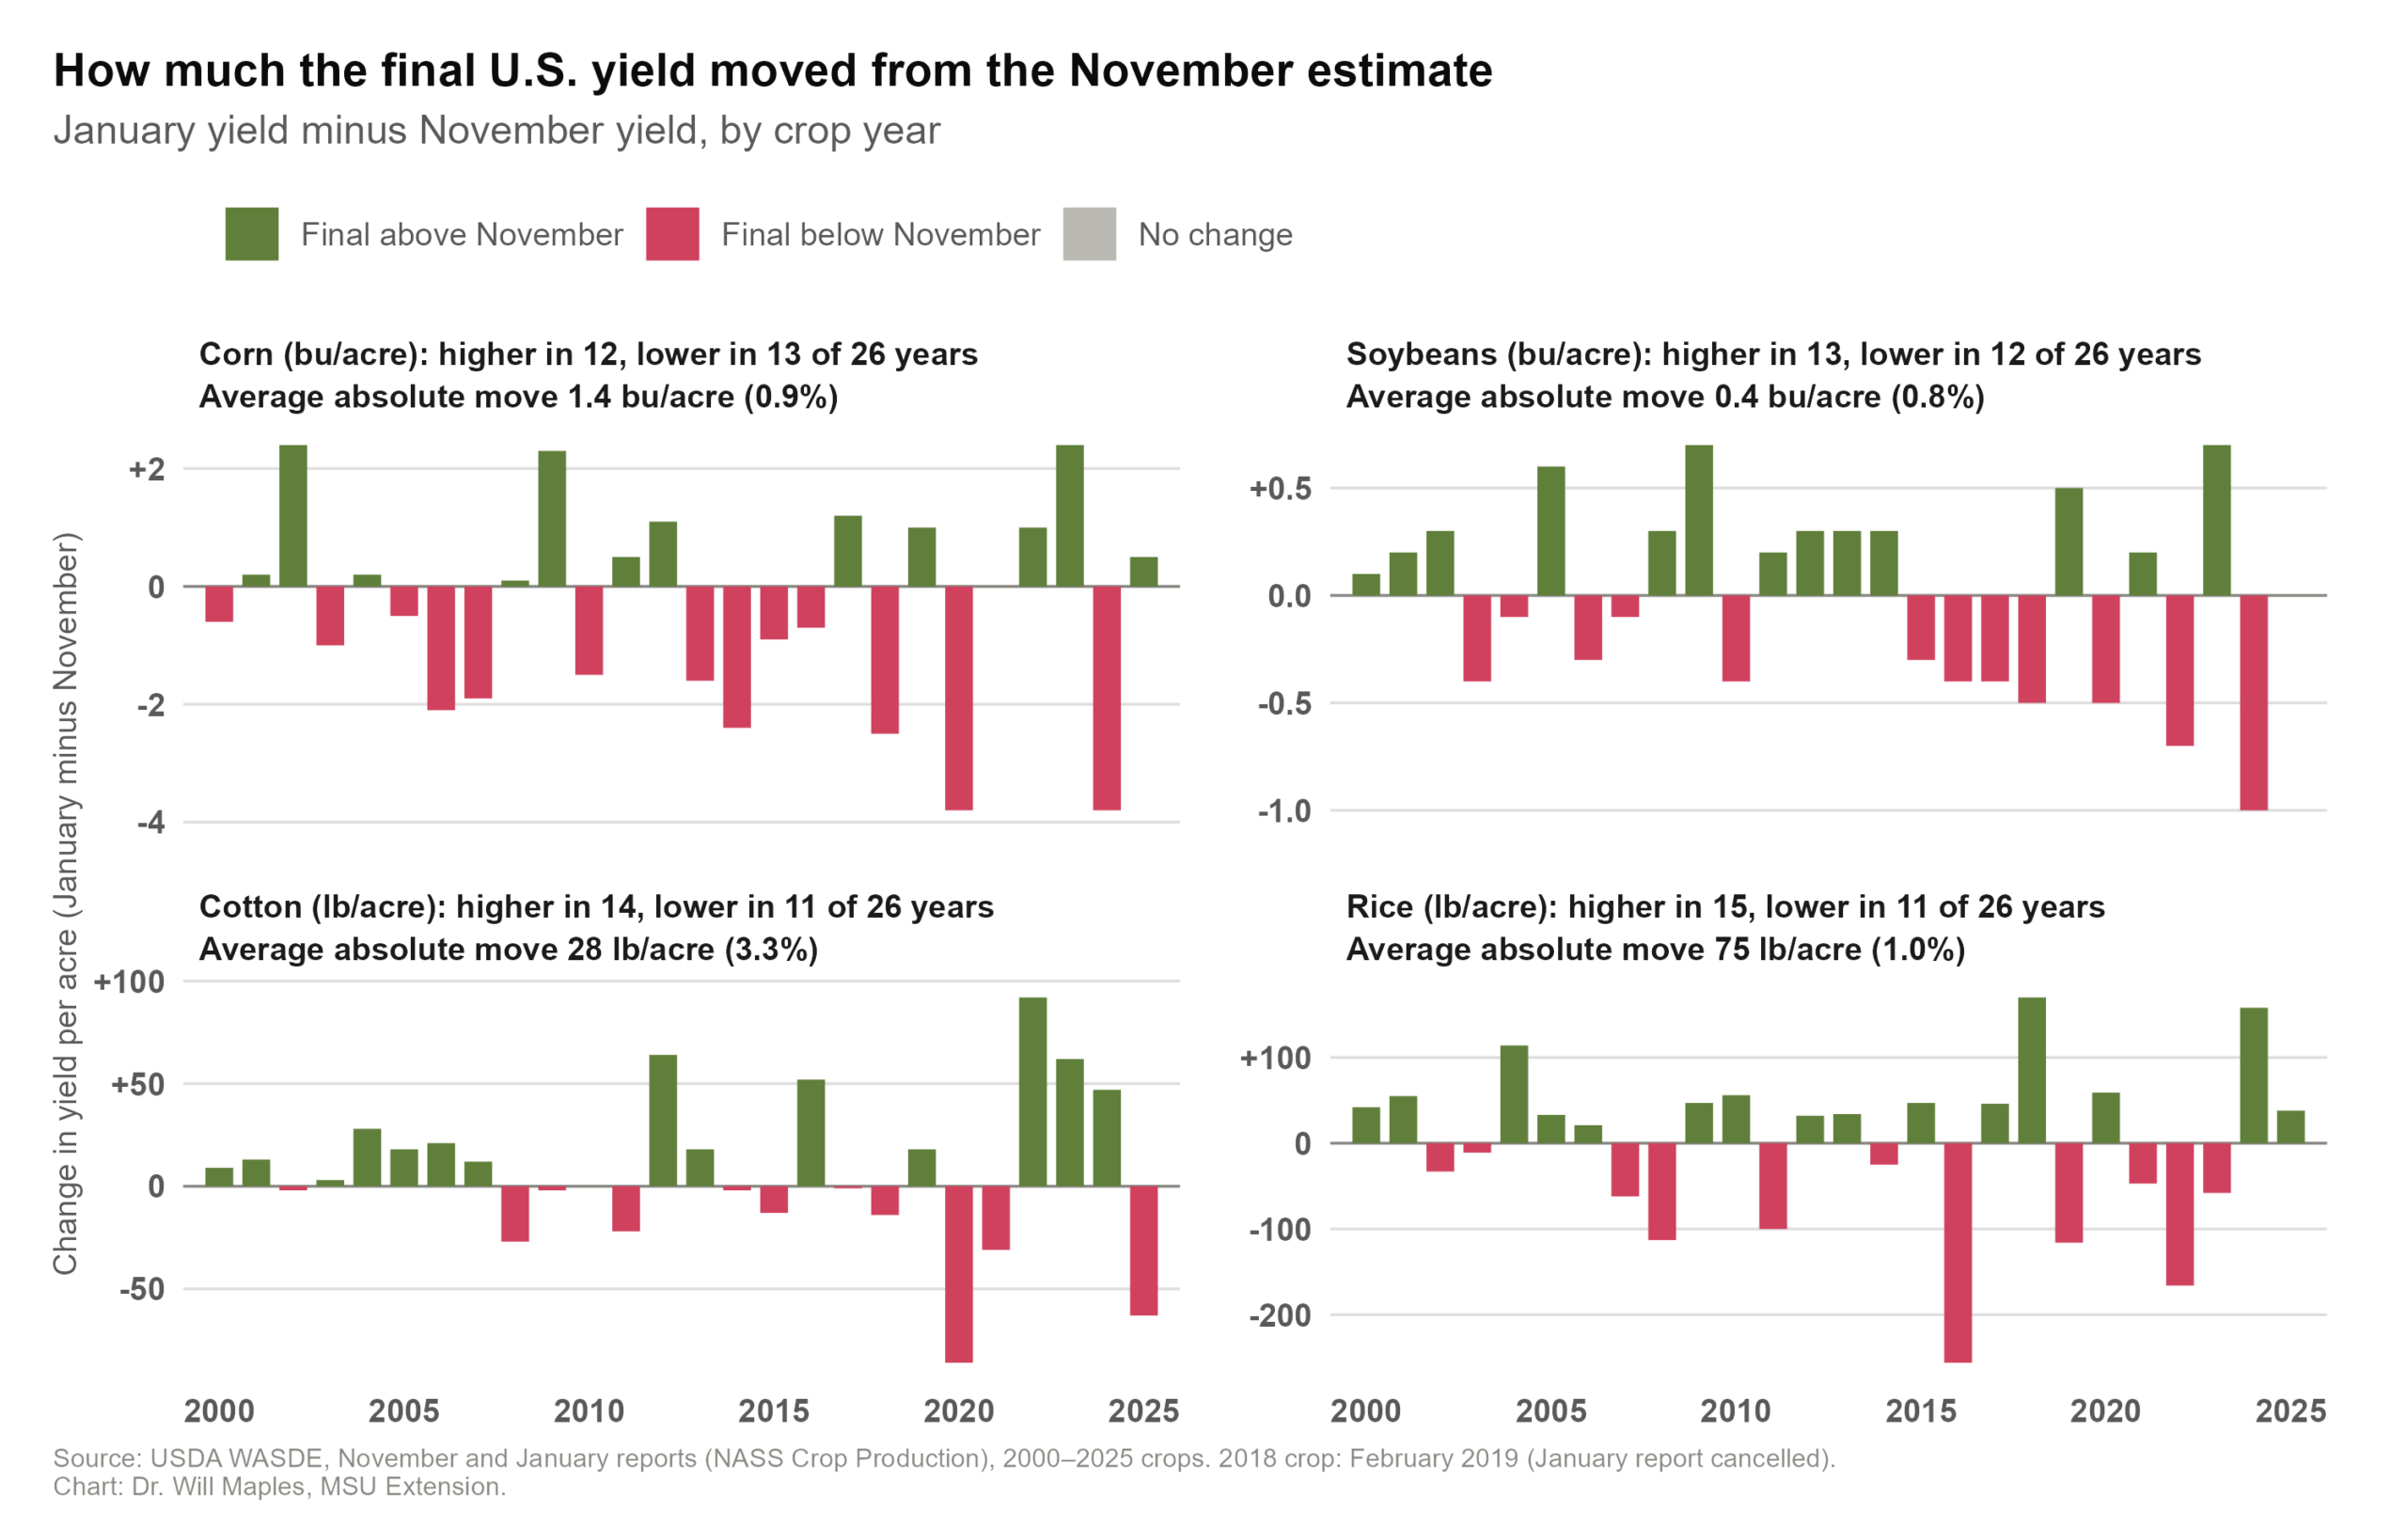
November is the last yield estimate for corn, soybeans and rice until USDA’s annual Crop Production summary in January; cotton gets one more forecast in December. Figure 1 shows how much the January yield has moved from the November estimate for each crop since 2000. For corn and soybeans, the direction of yield changes have been about 50/50. The January corn yield was adjusted higher in 12 years and lower in 13, with an average change of 1.4 bushels per acre in either direction. Soybeans were higher in 13 years and lower in 12, with an average change of 0.4 bushels in either direction.
Even average-size moves can shift ending stocks. With 88.5 million harvested acres, each 1-bushel change in the corn yield changes production by 88.5 million bushels, so an average 1.4-bushel move up or down would shift corn ending stocks by roughly 125 million bushels. The largest corn revisions since 2000 were cuts of 3.8 bushels in 2020 and 2024, about 335 million bushels. For soybeans, a 0.4-bushel move is about 35 million bushels, more than 10% of projected ending stocks. Revisions have also been larger in recent years. Since 2020, corn revisions have averaged 1.9 bushels in either direction.
Comparing yields to trend gives a slight hint on the direction of revisions. In years when the November corn yield was below trend, the January estimate raised it in 7 of 9 years. At 179.6 bushels per acre, this year’s estimate is about 3% below the trend yield of roughly 185 bushels, which leans toward a small increase in January. Soybeans are near trend, so history offers no lean either way. Yield is not the only thing that can change. For the 2022 crop, USDA raised the January corn yield by 1 bushel but cut harvested area by 1.6 million acres, so production fell 200 million bushels.
Cotton has the largest historical revisions of the four crops, averaging 28 pounds per acre, or 3.3%, in either direction. Revisions have grown recently, averaging 64 pounds since 2020. This year’s cotton yield is about 13% below trend, and short cotton crops have been raised in January in 10 of 15 years. However, a higher yield does not always mean more cotton. USDA lowered harvested area in 22 of the last 26 years as abandonment came into focus, thus production rose in only 8 of those years. For the 2023 crop, USDA raised the yield by 62 pounds but cut harvested area by 12%, so production fell 5%.
Since 2000, the January rice yield has been raised in 15 of 26 years. The average change, up or down, has been 75 pounds per acre, about 1%. Like corn, this year’s rice yield of 7,664 pounds is about 3% below trend, and below-trend rice crops have been raised in January in 8 of 13 years. With 2.06 million harvested acres, a 75-pound change in yield would change production by about 1.5 million hundredweight, close to 4% of projected ending stocks.
While most of the 2026 yield story has been written, USDA will still make changes in January, and history shows those changes can be large enough to move ending stocks. For producers still holding unpriced grain or cotton, the January report is a known risk event. Now is a good time to review marketing plans and decide how much exposure to carry into that report.
Figure 1. Yield Revisions from November to January
Recommended citation format: Maples, William E. “November WASDE Trims Corn Yield: How Much Can Yield Still Change by January?” Southern Ag Today 6(46.3). November 11, 2026. Permalink
