Authors: Luis Ribera and Landyn Young
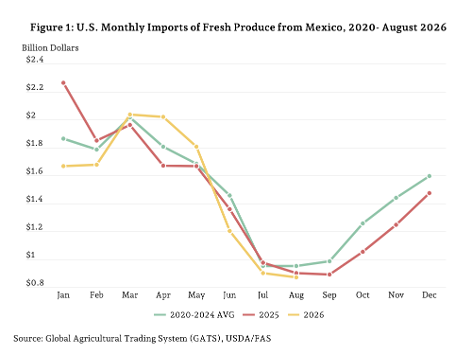
Produce imports from Mexico are a major source of economic activity throughout the United States, but are particularly important to Arizona, California, New Mexico, and Texas. Imports of produce from Mexico to the United States during 2025, including fresh, frozen, and processed fruits, vegetables, and nuts, totaled $18.1 billion. Looking at the five-year average prior to 2025, imports averaged $1.48 billion per month, with January (Figure 1) having the highest monthly value at $1.78 billion and the lowest being August at $952 million. In 2025, imports started much higher, totaling $2.27 billion in January and continuing to stay above average through February, but falling below the remaining months with the exception of July, where $21 million more was imported in 2025 than the 2020-2024 monthly average. Overall, 2025 fresh produce import numbers were $478 million below the 2020-2024 average, which is an average monthly decrease of $39.9 million. In 2026, imports for January started at the lowest point since 2020 at $1.67 billion but grew, totaling over $2 billion for both March and April. Similar to past years, imports decreased in June and have fallen through August, with import values in July and August averaging $885 million, lower than any year since 2020. Overall, through August 2026 numbers are $470 million lower than 2025 and $335 million lower than the 2020-24 average.
Just over 98 percent of produce imports entered the United States by land ports between Mexico and Texas, New Mexico, Arizona, and California. When considering only fresh fruits and vegetables, which is 90.5 percent of the total, imports totaled $16.1 billion. These imports were shipped in 595,836 forty-thousand-pound truckloads. About 57 percent of U.S. fresh fruit and vegetable imports from Mexico entered through Texas land ports, arriving in 341,869 truckloads and worth $11.8 billion. The most active single port for fresh produce imports from Mexico in 2025 was Pharr, Texas, with 221,554 truckloads followed by Nogales, Arizona, with 142,578 truckloads. Laredo, Texas (74,319 truckloads) and Otay Mesa, California (71,857 truckloads) rounded out the top four. Monthly imports from 2020-2024 averaged 947 thousand metric tons (TMT) with the largest total being 1.19 million metric tons (MMT) in March and the lowest reaching 655 TMT in September. During 2025, this decreased to 939 TMT of average monthly imports (Figure 2). The only months where imports exceeded the average in 2025 were January and July-September. Meanwhile in 2026, import volume has also dipped below previous year’s average despite seeing March and April total some of the highest monthly imports since 2020.
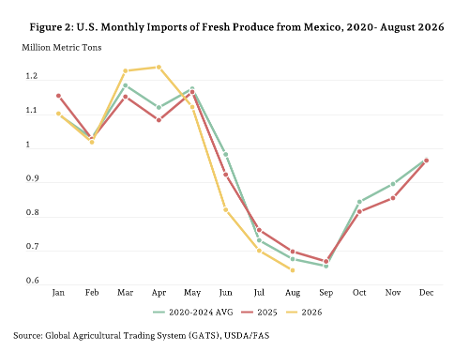
Any delays, disruptions, or related barriers to entry of fresh produce has the potential to cause ripple effects in the form of economic and employment losses across a wide spectrum of regional economies. For example, trade policy changes may have been a factor related to the lower import value in the latter part of 2025. Similarly, this downward trend in value is also evident in volume as the total import volume of fresh produce through August is 7.87 MMT in 2026, while in 2025 it was 7.97 MMT and from 2020-2024 it was 8 MMT.
Recommended citation format: Ribera, Luis, and Landyn Young. “Value and Volume of Fresh Produce Imports from Mexico.” Southern Ag Today 6(43.4). October 22, 2026. Permalink