Authors: Hunter D. Biram and H. Scott Stiles
The USDA’s World Agricultural Outlook Board (WAOB) released the monthly report of World Agricultural Supply and Demand Estimates (WASDE) on May 12th. That report contained the first forecasts for the 2026-27 marketing year. The following are some of the highlights of that report.
Soybeans
New crop, 2026 soybean production is forecast at 4.435 billion bushels, reflecting an average yield of 53 bushels and 83.7 million harvested acres. For its initial production estimates, USDA has traditionally used the March Prospective Plantings acreage estimate and the trend-yield assumption used at the February Ag Outlook Forum. Total consumption for the 2026 crop is expected to increase 218 million bushels to 4.49 billion on record crush (2.75 billion bu.) and modest improvement in exports (1.63 billion bu.). This places year-ending stocks at 310 million bushels, down from 340 million in the current year. The marketing year average farm price for the 2026 crop is projected at $11.40 compared to $10.40 in 2025-26.
Corn
The 2026-27 corn crop is projected at 16.0 billion bushels, down 6 percent from last year’s record crop on declines in both acreage and yield. Planted acres of 95.3 million acres are projected to be down 3.5 million. The yield projection of 183.0 bushels per acre is based on a weather adjusted trend assuming normal planting progress and summer growing season weather. Total corn supplies are seen declining 2 percent to 18.1 billion bushels. Total U.S. corn use for 2026/27 is forecast to fall 2 percent relative to a year ago on reductions in domestic use and exports. Food, seed, and industrial use is forecast flat at 6.955 billion bushels. Feed and residual use is projected down 100 million bushels to 6.1 billion bushels on lower production and higher prices. U.S. corn exports for 2026/27 are forecast to decline 150 million bushels from a year ago to 3.15 billion bushels. Driven by lower production, 2026-27 ending stocks are expected to decline 185 million bushels to 1.957 billion. The 2026-27 season-average farm price is projected at $4.40 per bushel, up 25 cents from $4.15 in the current marketing year.
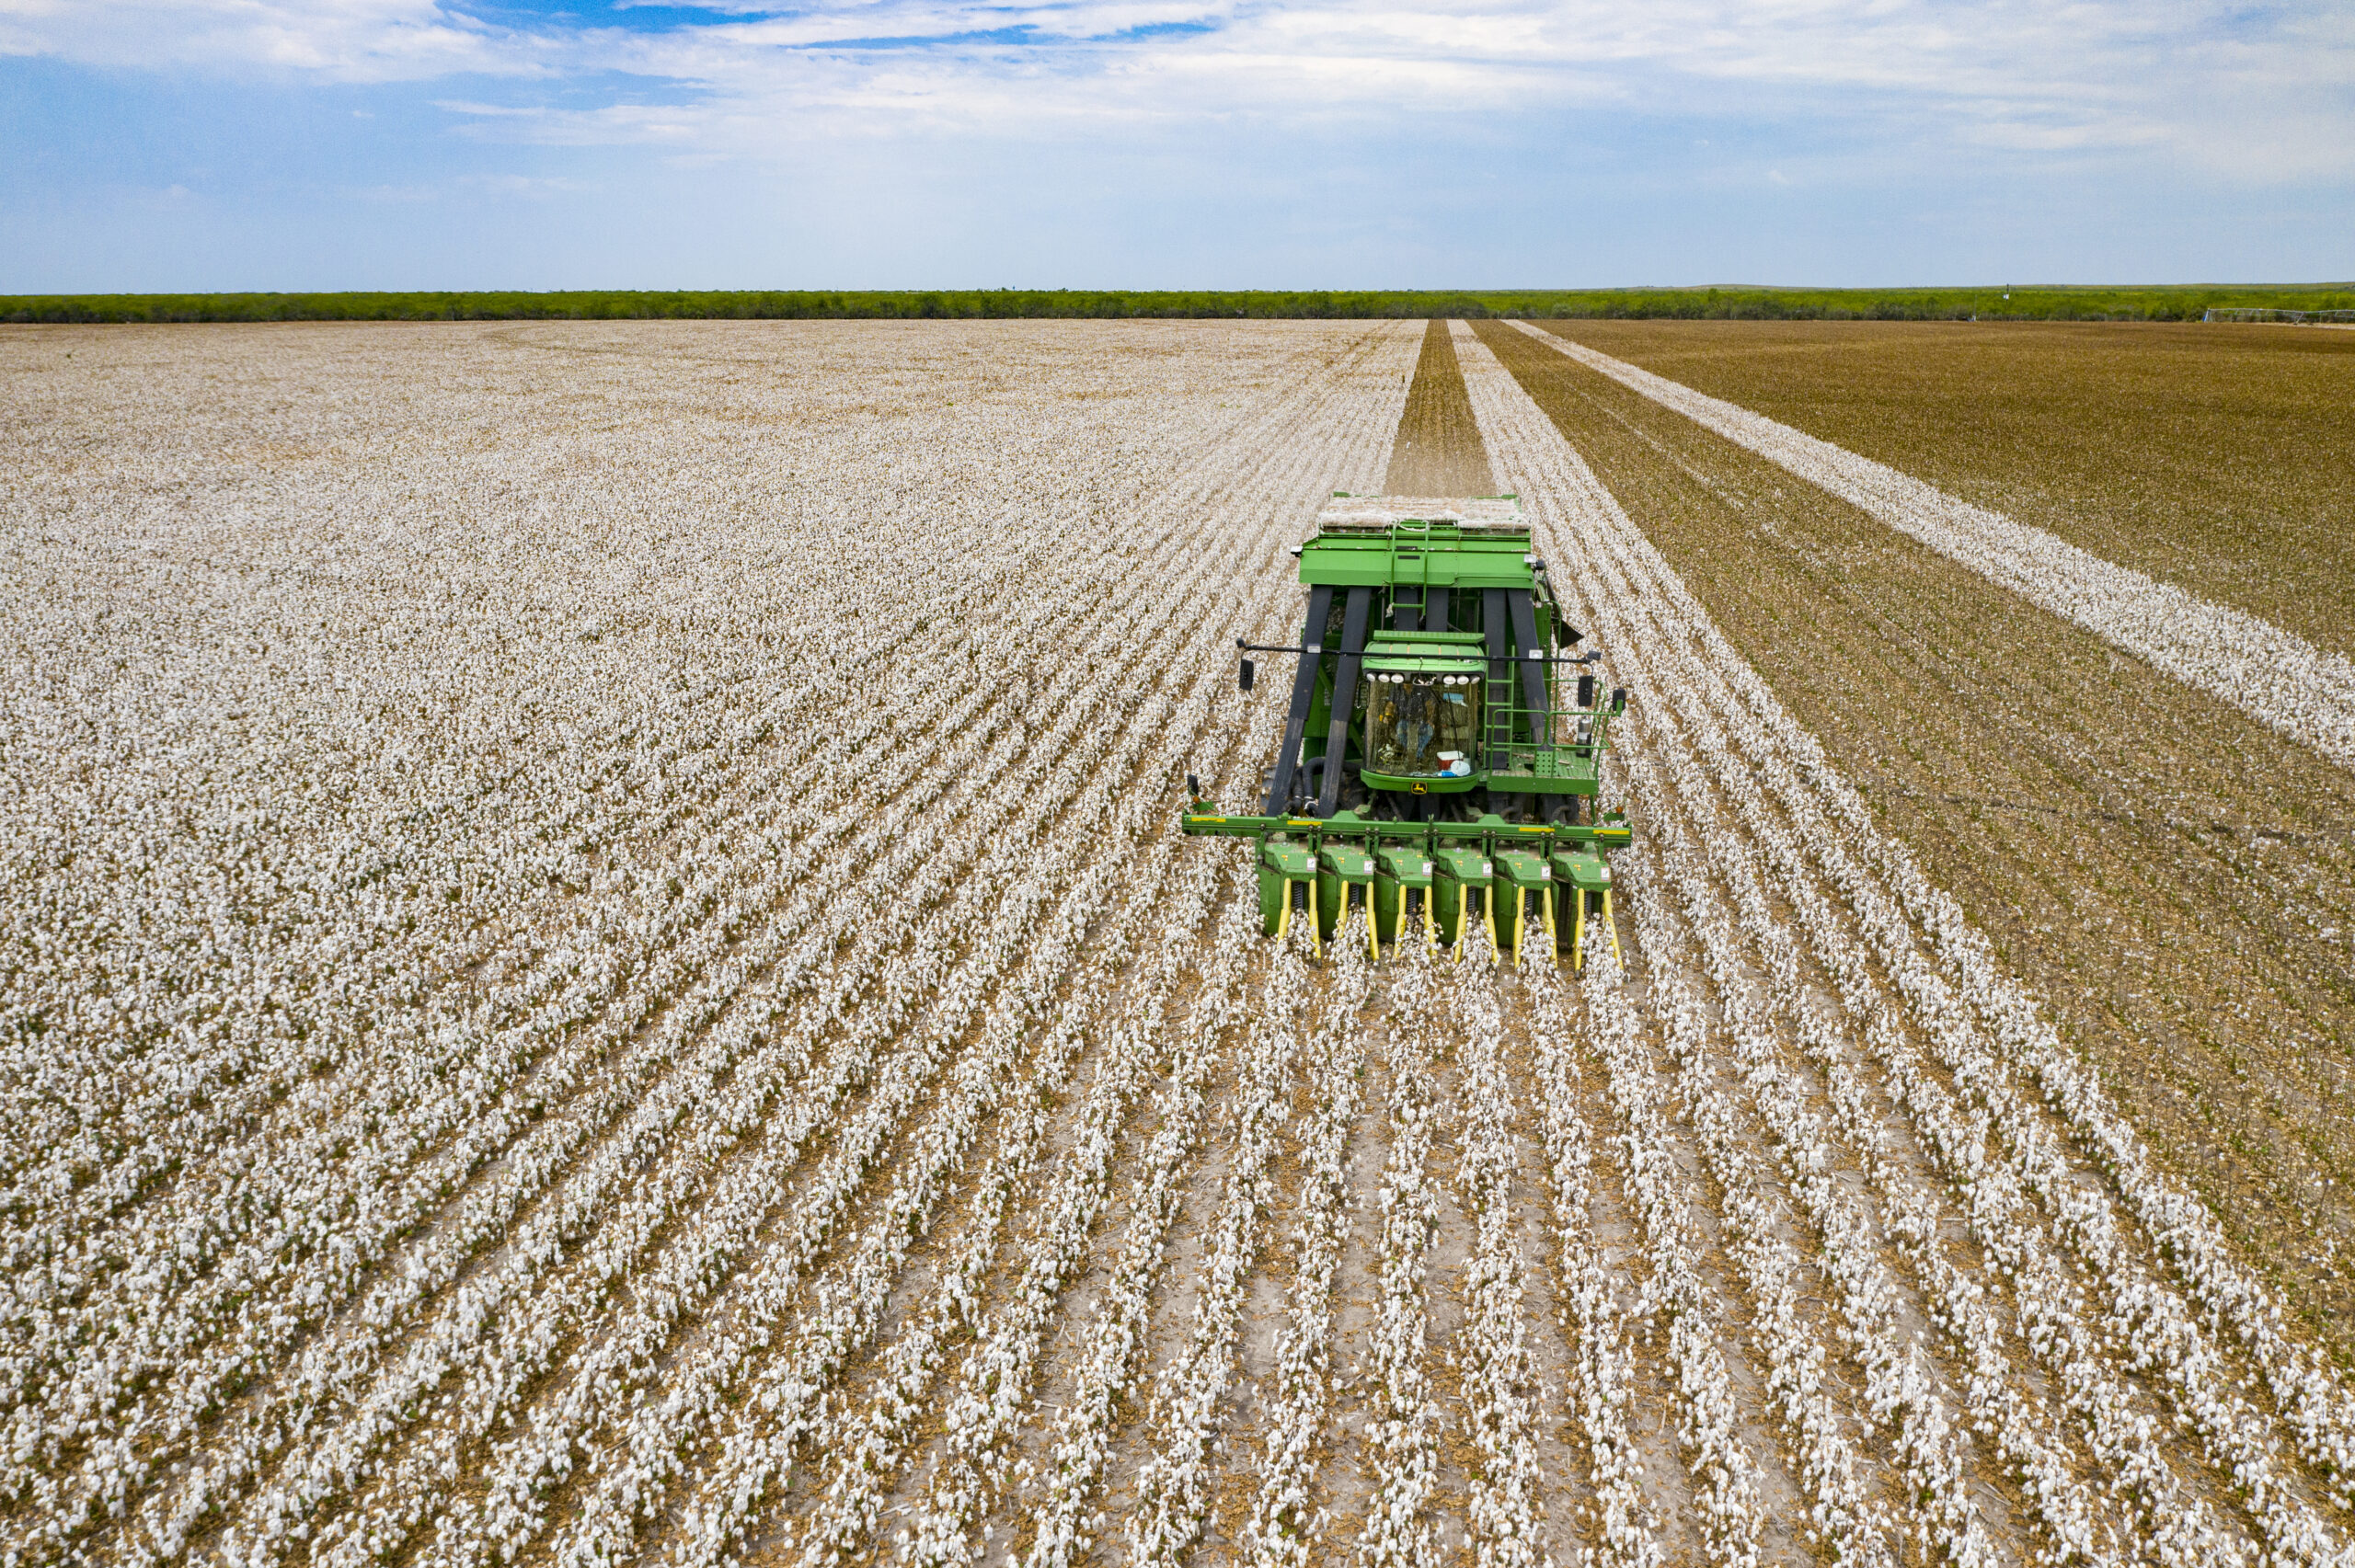
Cotton
The May U.S. cotton 2026-27 projections include a smaller crop, an increase in exports, unchanged mill use and lower ending stocks compared with the 2025-26 season. New crop production is expected to be 13.3 million bales, 600,000 bales less than in 2025-26. Domestic mill use is expected to be flat year-to-year at 1.6 million. Exports are expected to increase 300,000 bales to 12.3 million bales from 12 million in 2025-26. Ending stocks are expected to decrease to 3.9 million bales from 4.4 million in 2025-26. That is the least since 3.15 million in 2023-24 and below the 10-year average of 4.25 million bales. The forecast average price of 73 cents for the 2026-27 marketing year is up considerably compared to 63 cents for the 2025-26 crop.
Long-Grain Rice
U.S. long-grain production is projected at 122.5 million cwt, down 20 percent from last year on reduced acreage. This would be the smallest long-grain crop since 2011. Total supply is forecast at 201.1 million cwt, down nearly 12 percent from last year on lower production. Total use is projected at 173.0 million cwt, down from 188 million in the current year. Total exports are projected at 50 million cwt, down 1.0 million cwt from 2025-26, on continued strong global competition and higher U.S. long-grain prices. Domestic use is forecast at 123 million cwt., down 14 million from 2025-26. Ending stocks are projected at 28.1 million cwt, down 29 percent from last year and the lowest since 2023-24. The 2026-27 season average farm price for long-grain is projected at $12.00 per cwt, up from $10.40 in 2025-26.
There and Back Again
Season-average farm prices (SAFP) for southern crops are projected to increase between 6-16% compared to the 2025/2026 marketing year (Table 1). Notably, corn and soybeans are projected to increase by 6% and 9.6%, respectively, with new crop soybeans projected $1.00 per bushel higher than last marketing year and the highest since 2023/2024 marketing year. Long grain rice and cotton are projected to increase the most at 15.9% and 15.4%, respectively. However, even with year-over-year increases, breakeven yields for the new crop exceed that of the national average projected yield for the 2026/2027 marketing year. National breakeven yields, using the USDA cost of production forecasts, for corn, cotton, and long grain rice are 35%, 53%, and 44% above the current yield expectation while soybeans have a breakeven yield that is 12% above expectation.
Historical price movements over the 1996-2025 period suggest that new crop prices tend to fall 5-10% between the release of the May WASDE report and the end of a typical harvest season with some price declines as low as 15% (Figure 1). We note that while prices do tend to move lower into harvest on average, summer markets are often volatile as traders often respond to weather developments and resulting changes to yield expectations (Gardner and Biram, 2023). Often, new crop contracts establish seasonal highs in late June into July before declining into harvest reflecting a weather risk premium (Biram and Loy, 2024; Bhattarai et al., 2026).It is important that farmers consider leveraging appropriate price risk management tools, such as forward contracts, to lock in some price upside prior to harvest (Biram, McKenzie, and Bhattarai, 2025; Maples, 2026; and Gardner, 2026).
The complete May 2026 WASDE report can be found at this link.
| Table 1. Year-over-year changes in season-average farm prices and associated breakeven yields | |||||
| SAFP (25/26) | SAFP (26/27) | %Δ in SAFP | Breakeven Yield (26/27) | National Average Yield (26/27) | |
| Corn | $4.15/bu | $4.40/bu | +6.0% | 247.1 bu/acre | 183 bu/acre |
| Cotton | $0.63/lb | $0.73/lb | +15.9% | 1,322.5 lb/acre | 866 bu/acre |
| Long Grain Rice* | $4.69/bu | $5.41/bu | +15.4% | 247.1 bu/acre | 171.8 bu/acre |
| Soybeans | $10.40/bu | $11.40/bu | +9.6% | 59.5 bu/acre | 53 bu/acre |
Figure 1. Change in Harvest Month Futures Price Relative to Date of May WASDE (1996-2025)

References
Bhattarai, Chandan, Andrew McKenzie, Hunter Biram, Jesse Tack, and Alvaro Durand‐Morat. “Risk return of forward contracting corn with crop insurance.” Journal of the Agricultural and Applied Economics Association (2026).
Biram, Hunter, and Ryan Loy. “May WASDE Projects Higher Supplies and Lower Prices Again in 2024.” Southern Ag Today 4(20.1). May 13, 2024. Permalink
Biram, Hunter, Andrew M. McKenzie, and Chanda Bhattrai. “How can crop marketing and crop insurance go together?” Southern Ag Today 5(24.3). June 11, 2025. Permalink
Gardner, Grant. “Price Seasonality: What the Pattern Shows.” Southern Ag Today 6(6.3). February 4, 2026. Permalink
Gardner, Grant, and Hunter Biram. “USDA Acreage Report Results: Price and Crop Insurance Impacts.” Southern Ag Today. July 3, 2023. Permalink
Maples, Will. “A New Year, A Better Marketing Plan for the Farm.”Southern Ag Today 6(2.3). January 7, 2026. Permalink
Biram, Hunter, and H. Scott Stiles. “May 2026 WASDE Highlights for U.S. Supply and Demand and Implications for Price Risk Management.” Southern Ag Today 6(20.3). May 13, 2026. Permalink